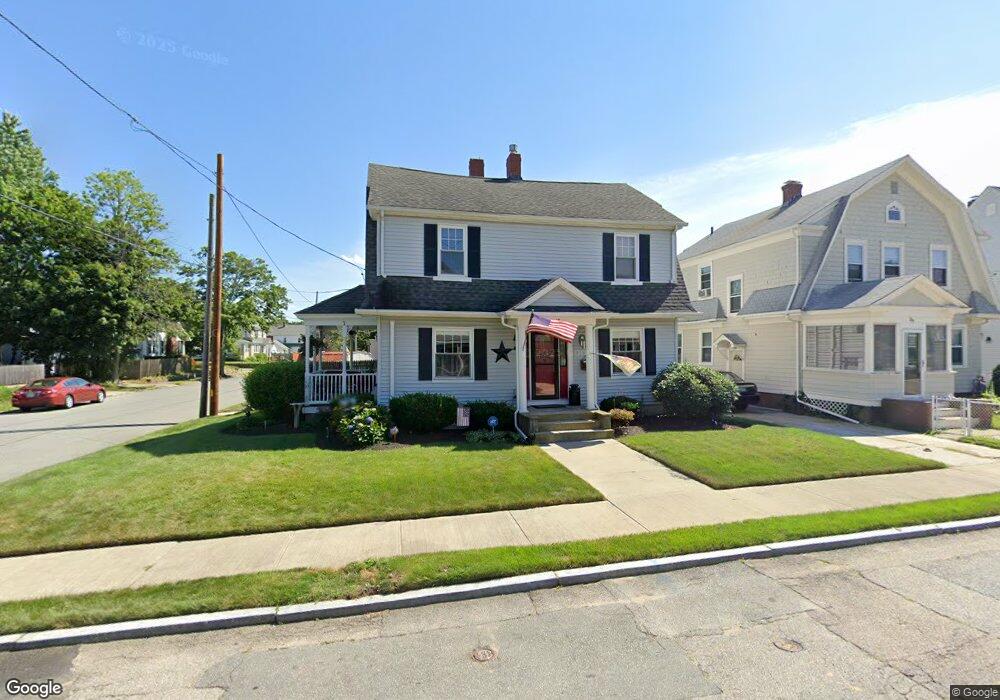
43 Friendly Rd Cranston, RI 02910
Estimated Value: $435,920 - $458,000
3
Beds
1
Bath
1,560
Sq Ft
$289/Sq Ft
Est. Value
About This Home
This home is located at 43 Friendly Rd, Cranston, RI 02910 and is currently estimated at $450,480, approximately $288 per square foot. 43 Friendly Rd is a home located in Providence County with nearby schools including W. R. Dutemple School, Park View Middle School, and Cranston High School East.
Ownership History
Date
Name
Owned For
Owner Type
Purchase Details
Closed on
Sep 21, 2023
Sold by
Carano Michael D and Carano Diana J
Bought by
Carano Ret and Carano
Current Estimated Value
Purchase Details
Closed on
May 26, 1994
Sold by
Pereira John R and Pereira Melissa
Bought by
Carano Michael D and Carano Diana
Create a Home Valuation Report for This Property
The Home Valuation Report is an in-depth analysis detailing your home's value as well as a comparison with similar homes in the area
Purchase History
| Date | Buyer | Sale Price | Title Company |
|---|---|---|---|
| Carano Ret | -- | None Available | |
| Carano Michael D | $101,000 | -- |
Source: Public Records
Mortgage History
| Date | Status | Borrower | Loan Amount |
|---|---|---|---|
| Previous Owner | Carano Michael D | $70,000 | |
| Previous Owner | Carano Michael D | $147,500 | |
| Previous Owner | Carano Michael D | $55,000 |
Source: Public Records
Tax History
| Year | Tax Paid | Tax Assessment Tax Assessment Total Assessment is a certain percentage of the fair market value that is determined by local assessors to be the total taxable value of land and additions on the property. | Land | Improvement |
|---|---|---|---|---|
| 2025 | $5,255 | $378,600 | $107,800 | $270,800 |
| 2024 | $5,153 | $378,600 | $107,800 | $270,800 |
| 2023 | $4,995 | $264,300 | $71,000 | $193,300 |
| 2022 | $4,892 | $264,300 | $71,000 | $193,300 |
| 2021 | $4,757 | $264,300 | $71,000 | $193,300 |
| 2020 | $4,374 | $210,600 | $67,600 | $143,000 |
| 2019 | $4,374 | $210,600 | $67,600 | $143,000 |
| 2018 | $4,273 | $210,600 | $67,600 | $143,000 |
| 2017 | $4,416 | $192,500 | $60,800 | $131,700 |
| 2016 | $4,322 | $192,500 | $60,800 | $131,700 |
| 2015 | $4,322 | $192,500 | $60,800 | $131,700 |
| 2014 | $4,088 | $179,000 | $60,800 | $118,200 |
Source: Public Records
Map
Nearby Homes
Your Personal Tour Guide
Ask me questions while you tour the home.