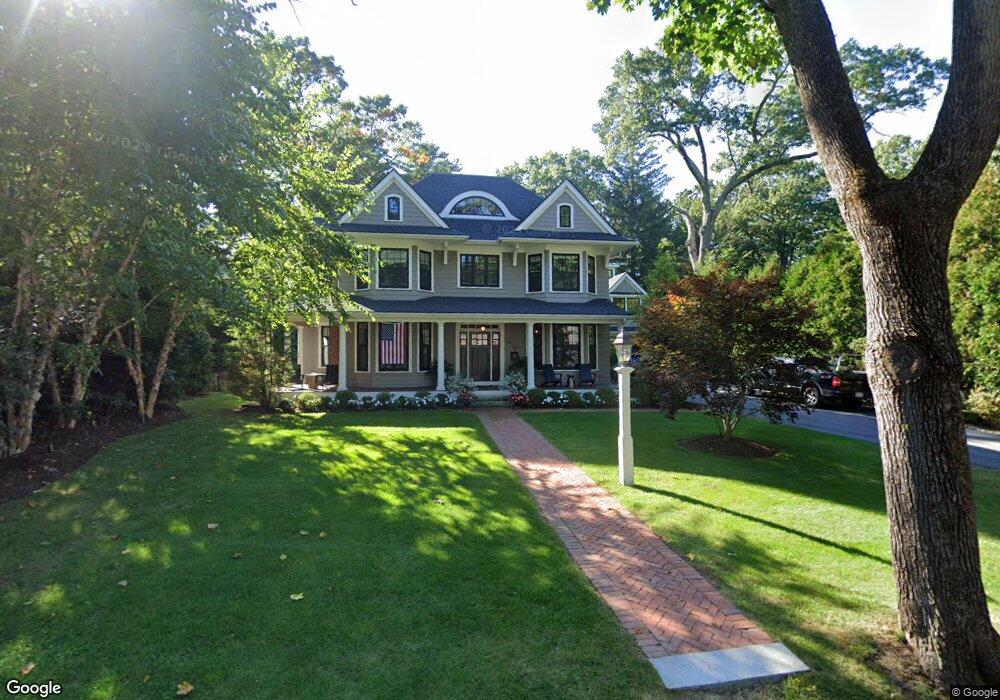
43 Gammons Rd Waban, MA 02468
Waban NeighborhoodEstimated Value: $1,988,000 - $6,970,000
6
Beds
7
Baths
5,222
Sq Ft
$990/Sq Ft
Est. Value
About This Home
This home is located at 43 Gammons Rd, Waban, MA 02468 and is currently estimated at $5,172,231, approximately $990 per square foot. 43 Gammons Rd is a home located in Middlesex County with nearby schools including Zervas Elementary School, Oak Hill Middle School, and Newton South High School.
Ownership History
Date
Name
Owned For
Owner Type
Purchase Details
Closed on
Sep 9, 2004
Sold by
Rocklin Suzanne E
Bought by
Kralis-Hoppe Mary
Current Estimated Value
Home Financials for this Owner
Home Financials are based on the most recent Mortgage that was taken out on this home.
Original Mortgage
$906,500
Interest Rate
6.08%
Mortgage Type
Purchase Money Mortgage
Purchase Details
Closed on
Aug 17, 1994
Sold by
Calceterra Victor F
Bought by
Rocklin Ross E and Rocklin Suzanne E
Purchase Details
Closed on
Feb 26, 1987
Sold by
Herson Steven
Bought by
Calcaterra Victor J
Create a Home Valuation Report for This Property
The Home Valuation Report is an in-depth analysis detailing your home's value as well as a comparison with similar homes in the area
Home Values in the Area
Average Home Value in this Area
Purchase History
| Date | Buyer | Sale Price | Title Company |
|---|---|---|---|
| Kralis-Hoppe Mary | $1,295,000 | -- | |
| Rocklin Ross E | $520,950 | -- | |
| Calcaterra Victor J | $273,000 | -- |
Source: Public Records
Mortgage History
| Date | Status | Borrower | Loan Amount |
|---|---|---|---|
| Open | Calcaterra Victor J | $840,000 | |
| Closed | Kralis-Hoppe Mary | $906,500 | |
| Previous Owner | Calcaterra Victor J | $50,000 |
Source: Public Records
Tax History Compared to Growth
Tax History
| Year | Tax Paid | Tax Assessment Tax Assessment Total Assessment is a certain percentage of the fair market value that is determined by local assessors to be the total taxable value of land and additions on the property. | Land | Improvement |
|---|---|---|---|---|
| 2025 | $54,951 | $5,607,200 | $1,843,100 | $3,764,100 |
| 2024 | $53,132 | $5,443,900 | $1,789,400 | $3,654,500 |
| 2023 | $51,563 | $5,065,100 | $1,402,500 | $3,662,600 |
| 2022 | $49,338 | $4,689,900 | $1,298,600 | $3,391,300 |
| 2021 | $8,260 | $4,424,400 | $1,225,100 | $3,199,300 |
| 2020 | $8,254 | $4,424,400 | $1,225,100 | $3,199,300 |
| 2019 | $44,888 | $4,295,500 | $1,189,400 | $3,106,100 |
| 2018 | $4,521 | $4,059,800 | $979,800 | $3,080,000 |
| 2017 | $42,590 | $3,830,000 | $924,300 | $2,905,700 |
| 2016 | $26,141 | $2,297,100 | $863,800 | $1,433,300 |
| 2015 | $14,392 | $1,239,600 | $807,300 | $432,300 |
Source: Public Records
Map
Nearby Homes
- 513 Chestnut St
- 479 Chestnut St
- 1430 Beacon St
- 443 Chestnut St
- 25 Allen Ave
- 29 Montclair Rd
- 80 Pine Ridge Rd
- 36 Troy Ln
- 115 Windsor Rd
- 6 Chatham Rd
- 1230 Commonwealth Ave
- 308 Prince St
- 20 Kinmonth Rd Unit 203
- 20 Kinmonth Rd Unit 306
- 222 Prince St
- 46 Ellis Rd
- 279 Chestnut St
- 35 Kingston Rd
- 10 Ruane Rd
- 18 Annawan Rd
- 35 Gammons Rd
- 53 Gammons Rd
- 530 Chestnut St
- 29 Gammons Rd
- 29 Gammons Rd Unit Furnished
- 29 Gammons Rd
- 29 Gammons Rd Unit Hse
- 63 Gammons Rd
- 27 Gammons Rd Unit 1
- 27 Gammons Rd
- 27 Gammons Rd Unit 27
- 522 Chestnut St
- 538 Chestnut St
- 44 Gammons Rd
- 38 Gammons Rd
- 38 Gammons Rd Unit 1
- 54 Gammons Rd
- 518 Chestnut St
- 14 Roslyn Rd
- 21 Gammons Rd