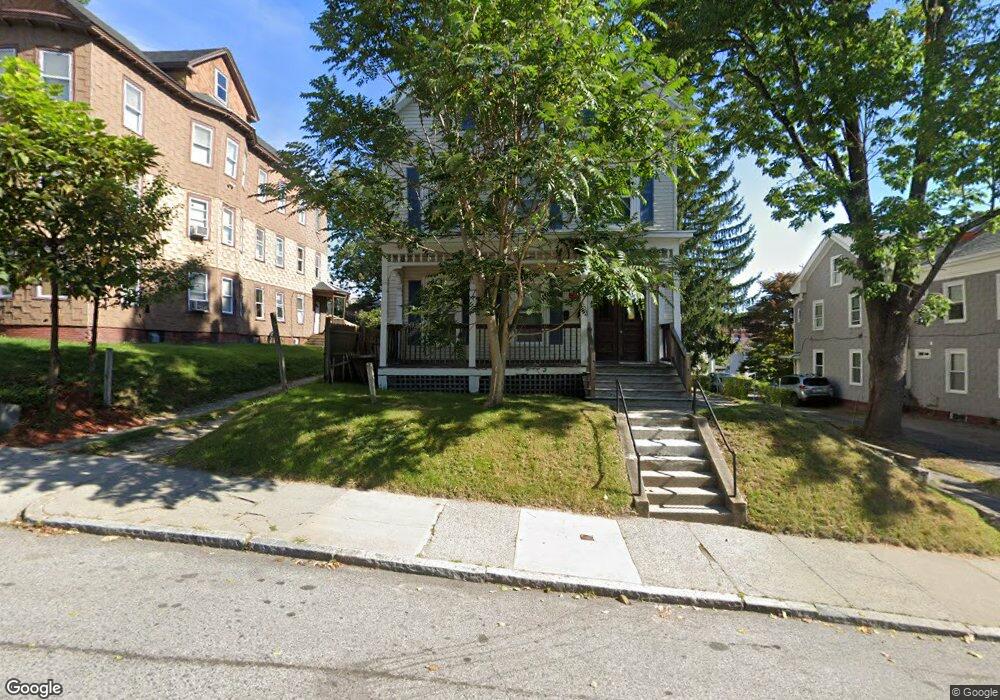
43 Gates St Worcester, MA 01610
Beacon Brightly NeighborhoodEstimated Value: $506,920 - $705,000
8
Beds
3
Baths
2,691
Sq Ft
$228/Sq Ft
Est. Value
About This Home
This home is located at 43 Gates St, Worcester, MA 01610 and is currently estimated at $612,230, approximately $227 per square foot. 43 Gates St is a home located in Worcester County with nearby schools including Goddard School of Science & Technology, Jacob Hiatt Magnet School, and Chandler Magnet.
Ownership History
Date
Name
Owned For
Owner Type
Purchase Details
Closed on
Oct 8, 2025
Sold by
Chambers Jimmy
Bought by
Wong Allen K
Current Estimated Value
Purchase Details
Closed on
Mar 1, 2025
Sold by
Qin Si and Song Hui
Bought by
Chambers Jimmy
Home Financials for this Owner
Home Financials are based on the most recent Mortgage that was taken out on this home.
Original Mortgage
$269,000
Interest Rate
6.58%
Mortgage Type
New Conventional
Purchase Details
Closed on
Jul 13, 2018
Sold by
Song Hui
Bought by
Song Hui and Qin Si
Purchase Details
Closed on
Dec 4, 2009
Sold by
Wilmington Finance Inc
Bought by
Song Hui
Home Financials for this Owner
Home Financials are based on the most recent Mortgage that was taken out on this home.
Original Mortgage
$80,000
Interest Rate
5.01%
Mortgage Type
Purchase Money Mortgage
Purchase Details
Closed on
Nov 13, 2009
Sold by
Nebo Josiah and Wilmington Finance Inc
Bought by
Wilmington Finance Inc
Home Financials for this Owner
Home Financials are based on the most recent Mortgage that was taken out on this home.
Original Mortgage
$80,000
Interest Rate
5.01%
Mortgage Type
Purchase Money Mortgage
Purchase Details
Closed on
Aug 6, 2001
Sold by
Vanle Than Van and Le Trinh Ngoc
Bought by
Nebo Josiah and Nebo Sanphie D
Purchase Details
Closed on
Dec 2, 1988
Sold by
Beauregard Robt
Bought by
Le Thanh
Create a Home Valuation Report for This Property
The Home Valuation Report is an in-depth analysis detailing your home's value as well as a comparison with similar homes in the area
Home Values in the Area
Average Home Value in this Area
Purchase History
| Date | Buyer | Sale Price | Title Company |
|---|---|---|---|
| Wong Allen K | $300,000 | -- | |
| Chambers Jimmy | $300,000 | -- | |
| Song Hui | -- | -- | |
| Song Hui | $118,000 | -- | |
| Song Hui | $118,000 | -- | |
| Wilmington Finance Inc | $185,000 | -- | |
| Wilmington Finance Inc | $185,000 | -- | |
| Nebo Josiah | $143,000 | -- | |
| Le Thanh | $107,000 | -- |
Source: Public Records
Mortgage History
| Date | Status | Borrower | Loan Amount |
|---|---|---|---|
| Previous Owner | Chambers Jimmy | $269,000 | |
| Previous Owner | Le Thanh | $102,400 | |
| Previous Owner | Song Hui | $80,000 | |
| Previous Owner | Le Thanh | $180,000 |
Source: Public Records
Tax History Compared to Growth
Tax History
| Year | Tax Paid | Tax Assessment Tax Assessment Total Assessment is a certain percentage of the fair market value that is determined by local assessors to be the total taxable value of land and additions on the property. | Land | Improvement |
|---|---|---|---|---|
| 2025 | $6,574 | $498,400 | $64,900 | $433,500 |
| 2024 | $6,219 | $452,300 | $64,900 | $387,400 |
| 2023 | $5,755 | $401,300 | $51,300 | $350,000 |
| 2022 | $5,646 | $371,200 | $41,000 | $330,200 |
| 2021 | $5,040 | $309,600 | $32,800 | $276,800 |
| 2020 | $4,641 | $273,000 | $32,800 | $240,200 |
| 2019 | $4,874 | $270,800 | $31,300 | $239,500 |
| 2018 | $4,712 | $249,200 | $31,300 | $217,900 |
| 2017 | $4,407 | $229,300 | $31,300 | $198,000 |
| 2016 | $4,431 | $215,000 | $21,500 | $193,500 |
| 2015 | $4,315 | $215,000 | $21,500 | $193,500 |
| 2014 | $3,572 | $182,800 | $21,500 | $161,300 |
Source: Public Records
Map
Nearby Homes
- 1 Cheney St
- 4 Albert St
- 7 Wyman St
- 21 Illinois St Unit 508
- 1 Hathaway St
- 28 Richards St
- 180 Canterbury St
- 5 Freeland Terrace
- 120 Grand St
- 21 Clement St
- 103 Illinois St
- 52 Richards St
- 73 Southgate St
- 6 Oliver St
- 54 Richards St
- 56 Richards St
- 215 Beacon St
- 33 Florence St
- 24 Litchfield St
- 14 Douglas Ct