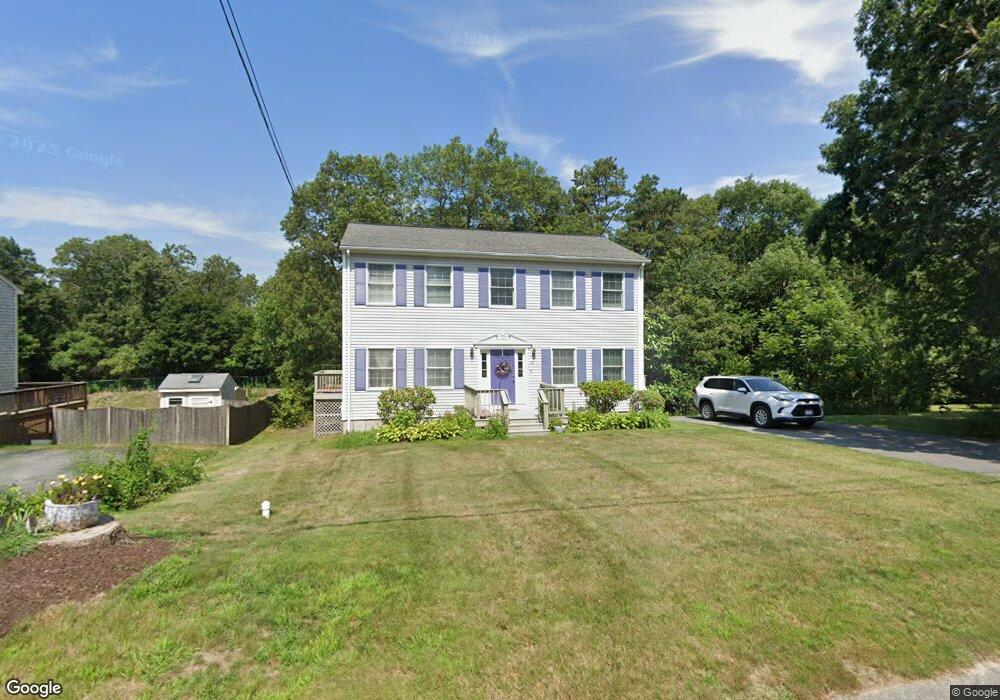
43 Grant St Attleboro, MA 02703
Estimated Value: $466,000 - $562,000
3
Beds
3
Baths
1,872
Sq Ft
$281/Sq Ft
Est. Value
About This Home
This home is located at 43 Grant St, Attleboro, MA 02703 and is currently estimated at $526,936, approximately $281 per square foot. 43 Grant St is a home located in Bristol County with nearby schools including Peter Thacher Elementary School, Cyril K. Brennan Middle School, and Attleboro High School.
Ownership History
Date
Name
Owned For
Owner Type
Purchase Details
Closed on
Apr 27, 2000
Sold by
Capron Michael and Lyons Martin
Bought by
Fisher Jo Ellen F and Clinton Katrina F
Current Estimated Value
Home Financials for this Owner
Home Financials are based on the most recent Mortgage that was taken out on this home.
Original Mortgage
$145,000
Interest Rate
8.23%
Mortgage Type
Purchase Money Mortgage
Create a Home Valuation Report for This Property
The Home Valuation Report is an in-depth analysis detailing your home's value as well as a comparison with similar homes in the area
Home Values in the Area
Average Home Value in this Area
Purchase History
| Date | Buyer | Sale Price | Title Company |
|---|---|---|---|
| Fisher Jo Ellen F | $41,000 | -- | |
| Fisher Jo Ellen F | $41,000 | -- |
Source: Public Records
Mortgage History
| Date | Status | Borrower | Loan Amount |
|---|---|---|---|
| Open | Fisher Jo Ellen F | $160,000 | |
| Closed | Fisher Jo Ellen F | $145,000 |
Source: Public Records
Tax History
| Year | Tax Paid | Tax Assessment Tax Assessment Total Assessment is a certain percentage of the fair market value that is determined by local assessors to be the total taxable value of land and additions on the property. | Land | Improvement |
|---|---|---|---|---|
| 2025 | $5,281 | $420,800 | $118,900 | $301,900 |
| 2024 | $5,138 | $403,600 | $118,900 | $284,700 |
| 2023 | $4,648 | $339,500 | $108,100 | $231,400 |
| 2022 | $4,432 | $306,700 | $103,000 | $203,700 |
| 2021 | $4,403 | $297,500 | $99,000 | $198,500 |
| 2020 | $4,218 | $289,700 | $96,100 | $193,600 |
| 2019 | $4,109 | $290,200 | $94,200 | $196,000 |
| 2018 | $0 | $267,100 | $91,500 | $175,600 |
| 2017 | $3,889 | $267,300 | $91,500 | $175,800 |
| 2016 | $3,822 | $257,900 | $89,700 | $168,200 |
| 2015 | $3,708 | $252,100 | $89,700 | $162,400 |
| 2014 | $3,650 | $245,800 | $85,500 | $160,300 |
Source: Public Records
Map
Nearby Homes
- 72 Grant St
- 1 Bellmore St
- 138 Fisher St Unit A
- 142 Fisher St Unit B
- 142 Fisher St Unit A
- 126 Linden St Unit A
- 0 Joseph St Unit 73469304
- 0 Tulip Unit 73482326
- 0 Tulip Unit 73482330
- 17 Jewel Ave
- 6 Dailey St Unit J
- 7 Dailey St Unit I
- 23 Greenhill Ave
- 855 County St Unit 2
- 147 County St
- 49 Dennis St
- 95 Mulberry St
- 21 4th St
- 75 Dennis St Unit 3
- 91 East St
Your Personal Tour Guide
Ask me questions while you tour the home.