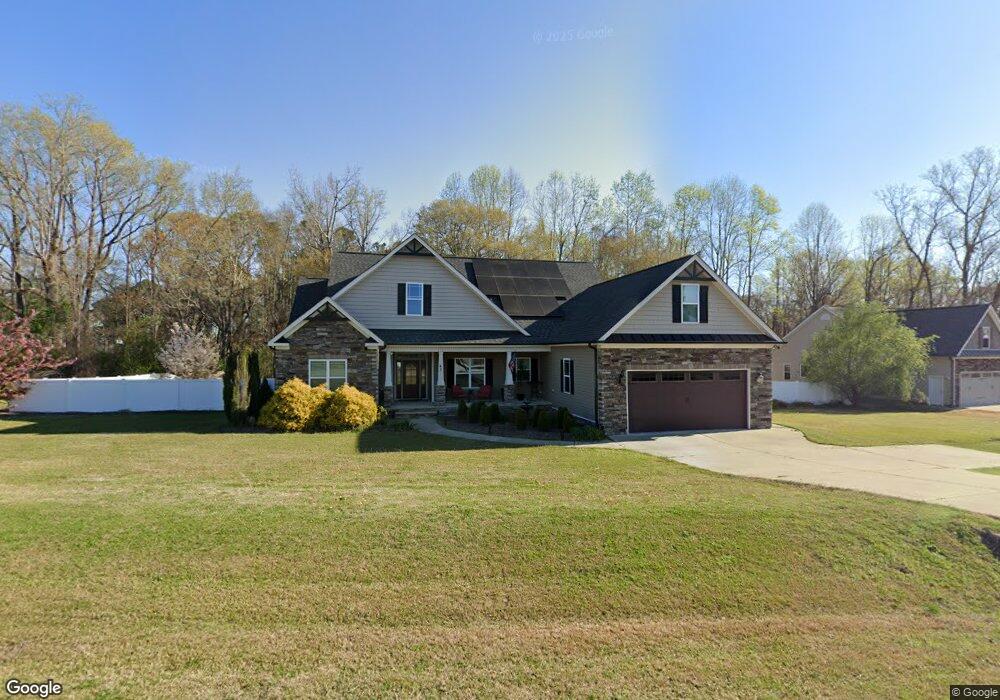
43 Hillgrove Dr Willow Spring, NC 27592
Pleasant Grove NeighborhoodEstimated Value: $468,000 - $586,000
3
Beds
3
Baths
2,803
Sq Ft
$185/Sq Ft
Est. Value
About This Home
This home is located at 43 Hillgrove Dr, Willow Spring, NC 27592 and is currently estimated at $517,394, approximately $184 per square foot. 43 Hillgrove Dr is a home with nearby schools including Dixon Road Elementary School, McGee's Crossroads Middle School, and West Johnston High School.
Ownership History
Date
Name
Owned For
Owner Type
Purchase Details
Closed on
Jul 26, 2020
Sold by
Brown James Preston and Brown Jessica Page
Bought by
Brown Jessica Page
Current Estimated Value
Purchase Details
Closed on
Oct 31, 2014
Sold by
Ken Dawson Homes Inc
Bought by
Brown James Preston and Brown Jessica Page
Home Financials for this Owner
Home Financials are based on the most recent Mortgage that was taken out on this home.
Original Mortgage
$285,441
Outstanding Balance
$220,656
Interest Rate
4.25%
Mortgage Type
FHA
Estimated Equity
$296,738
Purchase Details
Closed on
May 16, 2014
Sold by
S & S Land Development Llc
Bought by
Ken Dawson Homes Inc
Home Financials for this Owner
Home Financials are based on the most recent Mortgage that was taken out on this home.
Original Mortgage
$224,000
Interest Rate
4.32%
Mortgage Type
Construction
Create a Home Valuation Report for This Property
The Home Valuation Report is an in-depth analysis detailing your home's value as well as a comparison with similar homes in the area
Home Values in the Area
Average Home Value in this Area
Purchase History
| Date | Buyer | Sale Price | Title Company |
|---|---|---|---|
| Brown Jessica Page | -- | None Available | |
| Brown James Preston | $294,000 | None Available | |
| Ken Dawson Homes Inc | $38,000 | None Available |
Source: Public Records
Mortgage History
| Date | Status | Borrower | Loan Amount |
|---|---|---|---|
| Open | Brown James Preston | $285,441 | |
| Previous Owner | Ken Dawson Homes Inc | $224,000 |
Source: Public Records
Tax History Compared to Growth
Tax History
| Year | Tax Paid | Tax Assessment Tax Assessment Total Assessment is a certain percentage of the fair market value that is determined by local assessors to be the total taxable value of land and additions on the property. | Land | Improvement |
|---|---|---|---|---|
| 2025 | $3,032 | $477,550 | $82,500 | $395,050 |
| 2024 | $2,517 | $310,740 | $49,500 | $261,240 |
| 2023 | $2,439 | $310,740 | $49,500 | $261,240 |
| 2022 | $2,517 | $310,740 | $49,500 | $261,240 |
| 2021 | $2,517 | $310,740 | $49,500 | $261,240 |
| 2020 | $2,610 | $310,740 | $49,500 | $261,240 |
| 2019 | $2,548 | $310,740 | $49,500 | $261,240 |
| 2018 | $2,311 | $275,110 | $44,000 | $231,110 |
| 2017 | $2,311 | $275,110 | $44,000 | $231,110 |
| 2016 | $2,311 | $275,110 | $44,000 | $231,110 |
| 2015 | $370 | $275,110 | $44,000 | $231,110 |
| 2014 | $370 | $44,000 | $44,000 | $0 |
Source: Public Records
Map
Nearby Homes
- 50 Linden Ct
- 104 Holly Ranch Ct
- 19 Marie Ct
- 368 Artic Cir
- 111 Artic Cir
- 58 Tractor Place
- 164 Cool Creek Dr
- 181 Fawn Hill Ct
- 75 Fawn Hill Ct
- 48 Banbury Ct
- 160 W Fountainhead Ln
- 140 Fountainhead Ln
- 122 Fountainhead Ln
- 648 Fieldtrial Cir
- 104 Fountainhead Ln
- 336 Tennyson Dr
- 268 Tennyson Dr
- 623 Ravensworth Dr Unit Lot 149
- 595 Ravensworth Dr
- 228 Tennyson Dr
- 14026 Nc 50 Hwy N
- 12 Elmhurst Ln
- 46 Hillgrove Dr
- 101 Hillgrove Dr
- 28 Elmhurst Ln
- 14060 Nc 50 Hwy N
- 11 Elmhurst Ln
- 44 Elmhurst Ln
- 207 Clifton Dr
- 33 Elmhurst Ln
- 13954 Nc 50 Hwy N
- 125 Hillgrove Dr
- 25 Reese Dr Unit Lot 52
- 60 Elmhurst Ln
- 57 Elmhurst Ln
- 12 Dalry Ln
- 49 Reese Dr Unit Lot 51
- 72 Elmhurst Ln
- 24 Dalry Ln
- 210 Clifton Dr