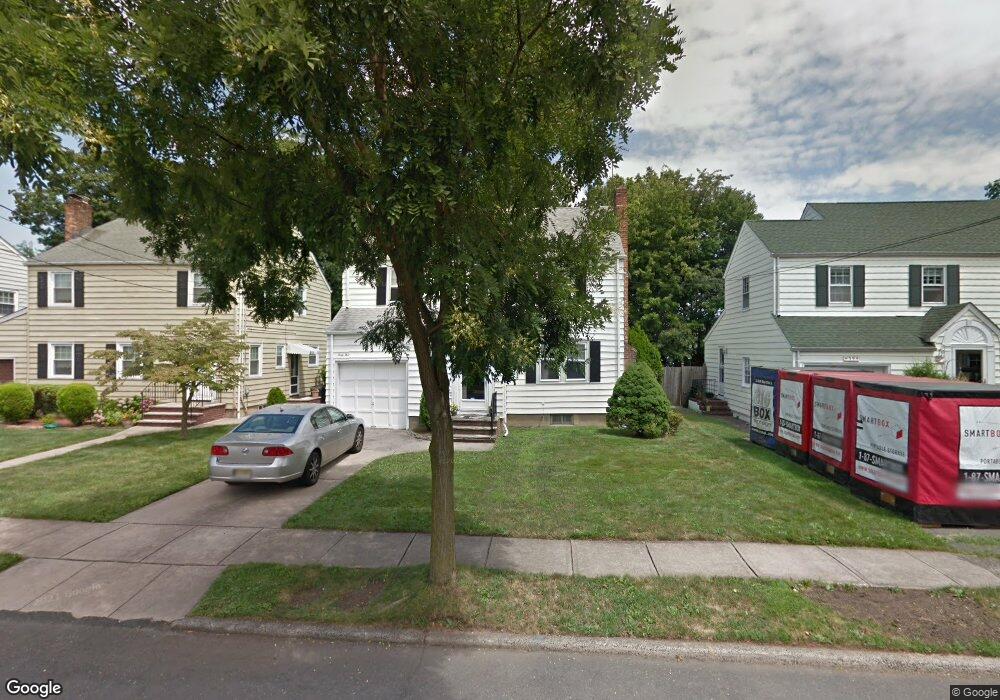
43 Hyde Rd Bloomfield, NJ 07003
Estimated Value: $569,000 - $740,000
Studio
--
Bath
1,332
Sq Ft
$490/Sq Ft
Est. Value
About This Home
This home is located at 43 Hyde Rd, Bloomfield, NJ 07003 and is currently estimated at $652,336, approximately $489 per square foot. 43 Hyde Rd is a home located in Essex County with nearby schools including Brookdale School, Bloomfield Middle School, and Bloomfield High School.
Ownership History
Date
Name
Owned For
Owner Type
Purchase Details
Closed on
Nov 28, 2016
Sold by
Dye Joseph H and Dye Christine
Bought by
Dye Brian J
Current Estimated Value
Home Financials for this Owner
Home Financials are based on the most recent Mortgage that was taken out on this home.
Original Mortgage
$140,415
Outstanding Balance
$116,353
Interest Rate
4.4%
Mortgage Type
FHA
Estimated Equity
$535,983
Purchase Details
Closed on
Aug 7, 1989
Sold by
Cary Linda E
Bought by
Dye Joseph H and Dye Christine
Create a Home Valuation Report for This Property
The Home Valuation Report is an in-depth analysis detailing your home's value as well as a comparison with similar homes in the area
Home Values in the Area
Average Home Value in this Area
Purchase History
| Date | Buyer | Sale Price | Title Company |
|---|---|---|---|
| Dye Brian J | $125,000 | Old Republic National Title | |
| Dye Joseph H | $220,000 | -- | |
| Dye Joseph | $220,000 | -- |
Source: Public Records
Mortgage History
| Date | Status | Borrower | Loan Amount |
|---|---|---|---|
| Open | Dye Brian J | $140,415 |
Source: Public Records
Tax History
| Year | Tax Paid | Tax Assessment Tax Assessment Total Assessment is a certain percentage of the fair market value that is determined by local assessors to be the total taxable value of land and additions on the property. | Land | Improvement |
|---|---|---|---|---|
| 2025 | $13,559 | $414,900 | $230,500 | $184,400 |
| 2024 | $13,559 | $414,900 | $230,500 | $184,400 |
| 2022 | $13,285 | $414,900 | $230,500 | $184,400 |
| 2021 | $13,040 | $414,900 | $230,500 | $184,400 |
| 2020 | $12,841 | $414,900 | $230,500 | $184,400 |
| 2019 | $12,803 | $321,600 | $191,000 | $130,600 |
| 2018 | $12,748 | $321,600 | $191,000 | $130,600 |
| 2017 | $12,555 | $321,600 | $191,000 | $130,600 |
| 2016 | $12,414 | $321,600 | $191,000 | $130,600 |
| 2015 | $12,301 | $321,600 | $191,000 | $130,600 |
| 2014 | $12,076 | $321,600 | $191,000 | $130,600 |
Source: Public Records
Map
Nearby Homes
Your Personal Tour Guide
Ask me questions while you tour the home.