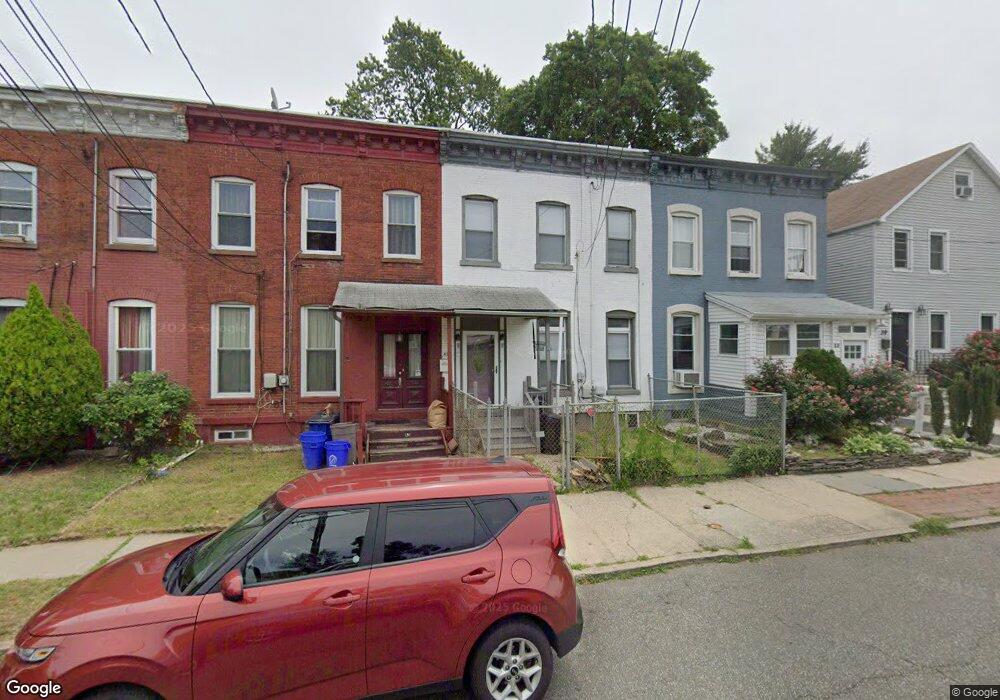
43 Lake St Bloomfield, NJ 07003
Estimated Value: $360,000 - $442,994
2
Beds
2
Baths
1,456
Sq Ft
$282/Sq Ft
Est. Value
About This Home
This home is located at 43 Lake St, Bloomfield, NJ 07003 and is currently estimated at $411,249, approximately $282 per square foot. 43 Lake St is a home located in Essex County with nearby schools including Berkeley School, Bloomfield Middle School, and Bloomfield High School.
Ownership History
Date
Name
Owned For
Owner Type
Purchase Details
Closed on
Jun 9, 2005
Sold by
253 E 33Rd St Llc
Bought by
Parker Jody
Current Estimated Value
Home Financials for this Owner
Home Financials are based on the most recent Mortgage that was taken out on this home.
Original Mortgage
$221,160
Outstanding Balance
$115,607
Interest Rate
5.78%
Mortgage Type
Purchase Money Mortgage
Estimated Equity
$295,642
Purchase Details
Closed on
Dec 9, 2004
Sold by
Natonick Donna
Bought by
253 E 33Rd St Llc
Create a Home Valuation Report for This Property
The Home Valuation Report is an in-depth analysis detailing your home's value as well as a comparison with similar homes in the area
Home Values in the Area
Average Home Value in this Area
Purchase History
| Date | Buyer | Sale Price | Title Company |
|---|---|---|---|
| Parker Jody | $228,000 | -- | |
| 253 E 33Rd St Llc | $100,000 | -- |
Source: Public Records
Mortgage History
| Date | Status | Borrower | Loan Amount |
|---|---|---|---|
| Open | Parker Jody | $221,160 |
Source: Public Records
Tax History Compared to Growth
Tax History
| Year | Tax Paid | Tax Assessment Tax Assessment Total Assessment is a certain percentage of the fair market value that is determined by local assessors to be the total taxable value of land and additions on the property. | Land | Improvement |
|---|---|---|---|---|
| 2025 | $6,860 | $209,900 | $50,900 | $159,000 |
| 2024 | $6,860 | $209,900 | $50,900 | $159,000 |
| 2022 | $6,721 | $209,900 | $50,900 | $159,000 |
| 2021 | $6,597 | $209,900 | $50,900 | $159,000 |
| 2020 | $6,496 | $209,900 | $50,900 | $159,000 |
| 2019 | $6,210 | $156,000 | $56,000 | $100,000 |
| 2018 | $6,184 | $156,000 | $56,000 | $100,000 |
| 2017 | $6,090 | $156,000 | $56,000 | $100,000 |
| 2016 | $6,022 | $156,000 | $56,000 | $100,000 |
| 2015 | $6,346 | $165,900 | $56,000 | $109,900 |
| 2014 | $6,230 | $165,900 | $56,000 | $109,900 |
Source: Public Records
Map
Nearby Homes
- 14 Crown St Unit 16
- 14-16 Crown St
- 60 Ella St
- 43 Charles St
- 198 Glenwood Ave
- 13 Thomas St
- 29 Thomas St
- 7 Myrtle St Unit 10
- 11 Evergreen Ave
- 22 Berkeley Heights Park
- 108 Thomas St
- 24 Llewellyn Ave
- 43 Llewellyn Ave
- 46 Lawrence St
- 39 Prospect St
- 25 Prospect St
- 21 Prospect St
- 78 Maolis Ave
- 0 Broad St
- 200 Montgomery St