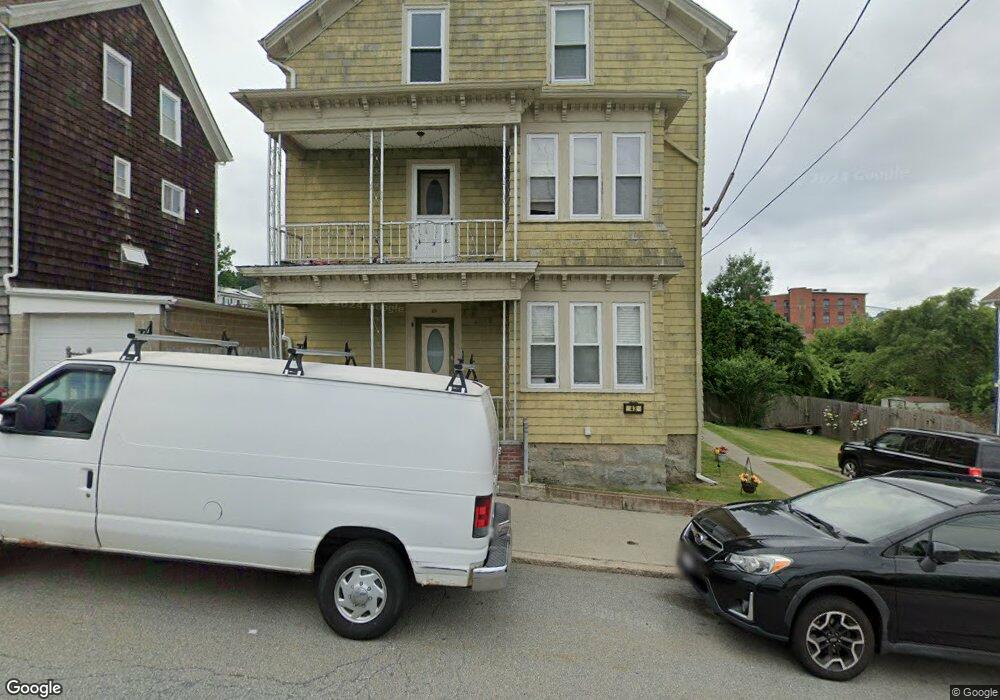
43 Langley St Fall River, MA 02720
Western Fall River NeighborhoodEstimated Value: $425,880 - $503,000
7
Beds
3
Baths
3,137
Sq Ft
$148/Sq Ft
Est. Value
About This Home
This home is located at 43 Langley St, Fall River, MA 02720 and is currently estimated at $463,470, approximately $147 per square foot. 43 Langley St is a home located in Bristol County with nearby schools including James Tansey Elementary School, Morton Middle School, and B M C Durfee High School.
Ownership History
Date
Name
Owned For
Owner Type
Purchase Details
Closed on
May 14, 2013
Sold by
Sousa Christine M
Bought by
Sousa Christine M and Sousa Kyle J
Current Estimated Value
Home Financials for this Owner
Home Financials are based on the most recent Mortgage that was taken out on this home.
Original Mortgage
$168,500
Outstanding Balance
$120,042
Interest Rate
3.6%
Mortgage Type
New Conventional
Estimated Equity
$343,428
Purchase Details
Closed on
Nov 1, 2010
Sold by
Gasperini Rosemary and Gasperini Andrea
Bought by
Paiva Christine M
Home Financials for this Owner
Home Financials are based on the most recent Mortgage that was taken out on this home.
Original Mortgage
$172,999
Interest Rate
4.39%
Mortgage Type
Purchase Money Mortgage
Create a Home Valuation Report for This Property
The Home Valuation Report is an in-depth analysis detailing your home's value as well as a comparison with similar homes in the area
Home Values in the Area
Average Home Value in this Area
Purchase History
| Date | Buyer | Sale Price | Title Company |
|---|---|---|---|
| Sousa Christine M | -- | -- | |
| Paiva Christine M | $177,500 | -- |
Source: Public Records
Mortgage History
| Date | Status | Borrower | Loan Amount |
|---|---|---|---|
| Open | Sousa Christine M | $168,500 | |
| Previous Owner | Paiva Christine M | $172,999 |
Source: Public Records
Tax History
| Year | Tax Paid | Tax Assessment Tax Assessment Total Assessment is a certain percentage of the fair market value that is determined by local assessors to be the total taxable value of land and additions on the property. | Land | Improvement |
|---|---|---|---|---|
| 2025 | $4,123 | $360,100 | $121,600 | $238,500 |
| 2024 | $3,980 | $346,400 | $119,300 | $227,100 |
| 2023 | $3,607 | $294,000 | $107,400 | $186,600 |
| 2022 | $3,260 | $258,300 | $101,400 | $156,900 |
| 2021 | $3,070 | $222,000 | $96,800 | $125,200 |
| 2020 | $2,818 | $195,000 | $92,400 | $102,600 |
| 2019 | $2,605 | $178,700 | $96,600 | $82,100 |
| 2018 | $2,561 | $175,200 | $97,300 | $77,900 |
| 2017 | $2,453 | $175,200 | $97,300 | $77,900 |
| 2016 | $2,403 | $176,300 | $100,300 | $76,000 |
| 2015 | $2,306 | $176,300 | $100,300 | $76,000 |
| 2014 | $2,306 | $183,300 | $100,300 | $83,000 |
Source: Public Records
Map
Nearby Homes
- 17 Langley St
- 164 Narragansett St
- 108 Stowe St Unit 108
- 160 Stewart St
- 131 Stewart St Unit 2
- 131 Stewart St Unit 3A
- 102 Vestal St
- 195 Crescent St Unit 3
- 208 Florence St
- 36 Saint Mary St
- 333 Langley St
- 82 Wellington St
- 213 Weetamoe St
- 376 N Underwood St
- 302 Cory St
- 29 Valentine St
- 33-35 Malvey St
- 1231 Robeson St
- 247 Albany St
- 327 Brownell St
- 43 Langley St Unit 3
- 43 Langley St Unit 2
- 49 Langley St Unit 57
- 27 Langley St
- 46 Langley St Unit 48
- 48 Langley St
- 48 Langley St Unit N/A
- 48 Langley St Unit B
- 46-48 Langley St
- 46 Langley St
- 67 Langley St
- 36 Langley St
- 1723 N Main St
- 1711 N Main St
- 77 Langley St
- 1717 N Main St
- 1717 N Main St
- 1717 N Main St
- 64 Langley St
- 1699 N Main St
Your Personal Tour Guide
Ask me questions while you tour the home.