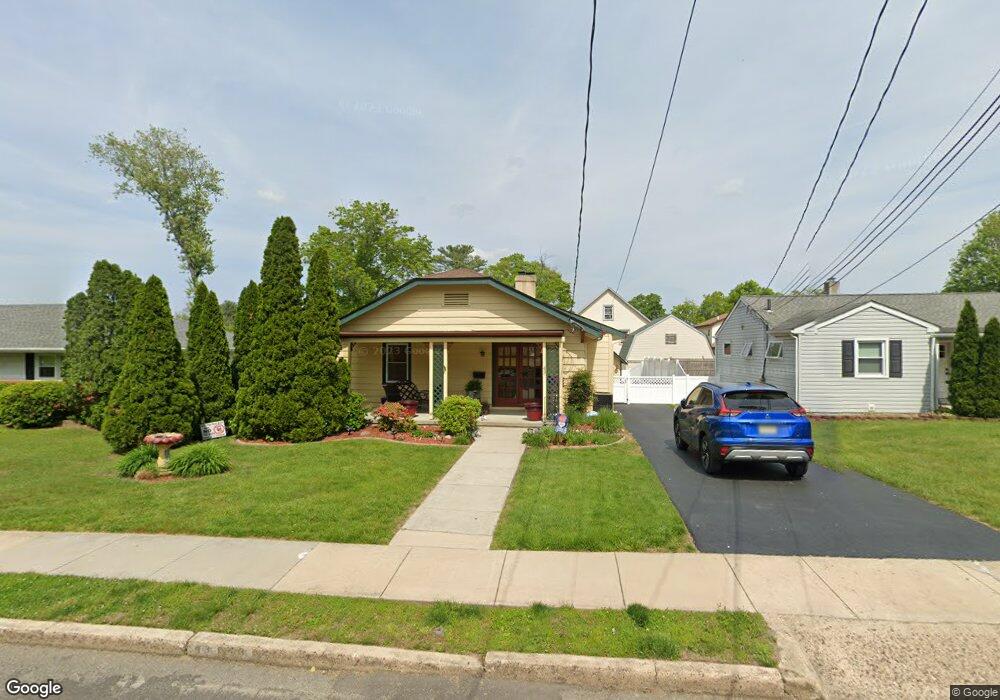
43 Linden Ave Pitman, NJ 08071
Estimated Value: $349,000 - $365,000
3
Beds
2
Baths
1,488
Sq Ft
$238/Sq Ft
Est. Value
About This Home
This home is located at 43 Linden Ave, Pitman, NJ 08071 and is currently estimated at $354,594, approximately $238 per square foot. 43 Linden Ave is a home located in Gloucester County with nearby schools including Memorial Elementary School, Pitman Middle School, and Pitman High School.
Ownership History
Date
Name
Owned For
Owner Type
Purchase Details
Closed on
Sep 30, 2009
Sold by
Watson Jacob S and Watson Tressa C
Bought by
Suarez Karen
Current Estimated Value
Home Financials for this Owner
Home Financials are based on the most recent Mortgage that was taken out on this home.
Original Mortgage
$186,558
Outstanding Balance
$122,068
Interest Rate
5.12%
Mortgage Type
FHA
Estimated Equity
$232,526
Purchase Details
Closed on
Jun 21, 2002
Sold by
Watson Calvin P and Watson Jean A
Bought by
Watson Jacob S and Schwenger Tressa C
Home Financials for this Owner
Home Financials are based on the most recent Mortgage that was taken out on this home.
Original Mortgage
$92,000
Interest Rate
6.79%
Mortgage Type
Stand Alone First
Purchase Details
Closed on
May 7, 1998
Sold by
Carter Franklin S
Bought by
Watson Calvin P and Watson Jean A
Purchase Details
Closed on
Mar 10, 1998
Sold by
Carter Franklin S
Bought by
Carter Franklin S and Carter Franklin Bruce
Create a Home Valuation Report for This Property
The Home Valuation Report is an in-depth analysis detailing your home's value as well as a comparison with similar homes in the area
Home Values in the Area
Average Home Value in this Area
Purchase History
| Date | Buyer | Sale Price | Title Company |
|---|---|---|---|
| Suarez Karen | $190,000 | First American Title Ins Co | |
| Watson Jacob S | $115,000 | -- | |
| Watson Calvin P | $58,000 | Lawrence Abstract Company | |
| Carter Franklin S | -- | Lawrence Abstract Company | |
| Carter Franklin S | -- | -- |
Source: Public Records
Mortgage History
| Date | Status | Borrower | Loan Amount |
|---|---|---|---|
| Open | Suarez Karen | $186,558 | |
| Previous Owner | Watson Jacob S | $92,000 |
Source: Public Records
Tax History Compared to Growth
Tax History
| Year | Tax Paid | Tax Assessment Tax Assessment Total Assessment is a certain percentage of the fair market value that is determined by local assessors to be the total taxable value of land and additions on the property. | Land | Improvement |
|---|---|---|---|---|
| 2025 | $7,416 | $212,300 | $59,900 | $152,400 |
| 2024 | $7,220 | $212,300 | $59,900 | $152,400 |
| 2023 | $7,220 | $212,300 | $59,900 | $152,400 |
| 2022 | $6,936 | $212,300 | $59,900 | $152,400 |
| 2021 | $7,379 | $164,600 | $46,600 | $118,000 |
| 2020 | $7,292 | $164,600 | $46,600 | $118,000 |
| 2019 | $7,121 | $164,600 | $46,600 | $118,000 |
| 2018 | $7,000 | $164,600 | $46,600 | $118,000 |
| 2017 | $6,913 | $164,600 | $46,600 | $118,000 |
| 2016 | $6,780 | $164,600 | $46,600 | $118,000 |
| 2015 | $6,597 | $164,600 | $46,600 | $118,000 |
| 2014 | $6,395 | $164,600 | $46,600 | $118,000 |
Source: Public Records
Map
Nearby Homes
- 41 Linden Ave
- 47 Linden Ave
- 37 Linden Ave
- 42 N Fernwood Ave
- 50 N Fernwood Ave
- 38 N Fernwood Ave
- 33 Linden Ave
- 95B Linden Ave Unit 95B
- 26 N Fernwood Ave
- 50 Linden Ave
- 46 Linden Ave
- 52 Linden Ave
- 95 Linden Ave
- 95 Linden Ave Unit 95B
- 44 Linden Ave
- 56 Linden Ave
- 40 Linden Ave
- 58 N Fernwood Ave
- 58 Linden Ave
- 38 Linden Ave