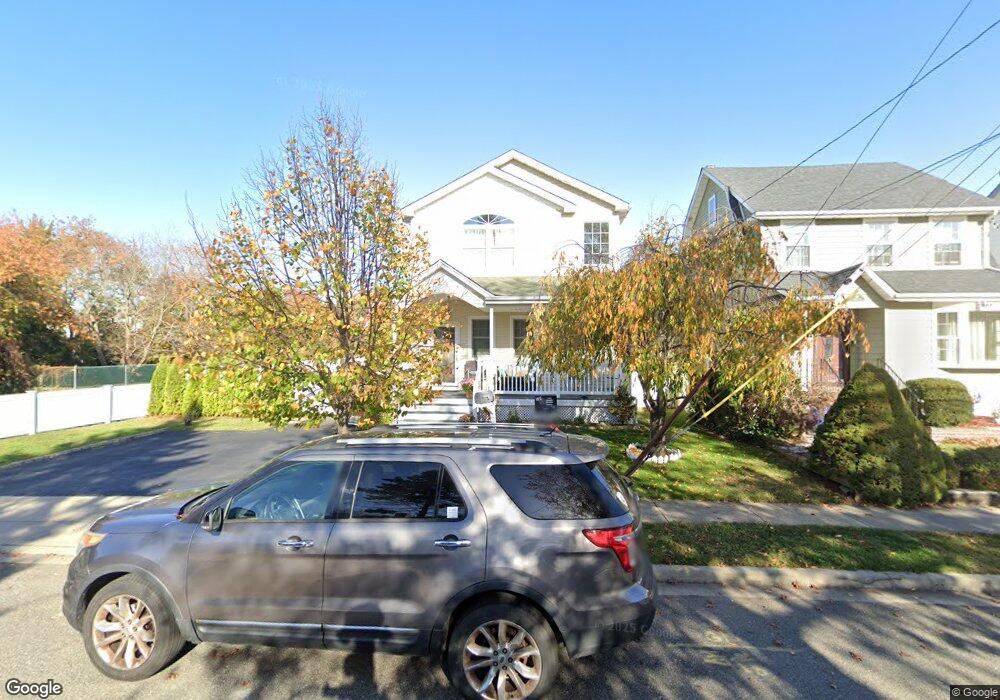
43 Maiden Ln Lynbrook, NY 11563
Estimated Value: $749,000 - $760,505
3
Beds
2
Baths
1,378
Sq Ft
$548/Sq Ft
Est. Value
About This Home
This home is located at 43 Maiden Ln, Lynbrook, NY 11563 and is currently estimated at $754,753, approximately $547 per square foot. 43 Maiden Ln is a home located in Nassau County with nearby schools including Lynbrook Senior High School and Our Lady Of Peace School.
Ownership History
Date
Name
Owned For
Owner Type
Purchase Details
Closed on
Oct 23, 2013
Sold by
Bachmann Brian and Bachmann Donna
Bought by
Hynes Michael and Hynes Julie
Current Estimated Value
Home Financials for this Owner
Home Financials are based on the most recent Mortgage that was taken out on this home.
Original Mortgage
$391,500
Outstanding Balance
$292,575
Interest Rate
4.36%
Estimated Equity
$462,178
Purchase Details
Closed on
Mar 11, 2003
Sold by
Walsh Donna
Purchase Details
Closed on
Apr 10, 2000
Create a Home Valuation Report for This Property
The Home Valuation Report is an in-depth analysis detailing your home's value as well as a comparison with similar homes in the area
Home Values in the Area
Average Home Value in this Area
Purchase History
| Date | Buyer | Sale Price | Title Company |
|---|---|---|---|
| Hynes Michael | $435,000 | -- | |
| -- | -- | -- | |
| -- | -- | -- |
Source: Public Records
Mortgage History
| Date | Status | Borrower | Loan Amount |
|---|---|---|---|
| Open | Hynes Michael | $391,500 |
Source: Public Records
Tax History Compared to Growth
Tax History
| Year | Tax Paid | Tax Assessment Tax Assessment Total Assessment is a certain percentage of the fair market value that is determined by local assessors to be the total taxable value of land and additions on the property. | Land | Improvement |
|---|---|---|---|---|
| 2025 | $10,959 | $528 | $229 | $299 |
| 2024 | $995 | $528 | $229 | $299 |
| 2023 | $9,428 | $528 | $229 | $299 |
| 2022 | $9,428 | $528 | $229 | $299 |
| 2021 | $12,642 | $514 | $207 | $307 |
| 2020 | $7,772 | $619 | $510 | $109 |
| 2019 | $7,959 | $663 | $512 | $151 |
| 2018 | $7,880 | $707 | $0 | $0 |
| 2017 | $8,333 | $872 | $546 | $326 |
| 2016 | $9,468 | $872 | $546 | $326 |
| 2015 | $1,166 | $872 | $546 | $326 |
| 2014 | $1,166 | $872 | $546 | $326 |
| 2013 | $1,188 | $872 | $546 | $326 |
Source: Public Records
Map
Nearby Homes