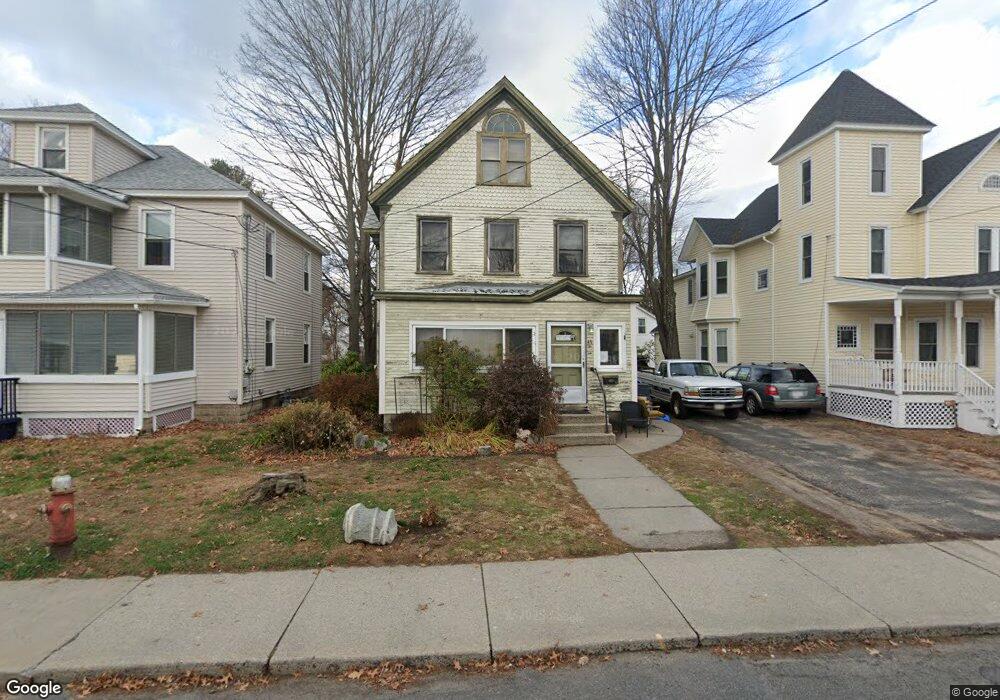
43 Maple St Easthampton, MA 01027
Estimated Value: $391,000 - $505,000
4
Beds
2
Baths
1,914
Sq Ft
$228/Sq Ft
Est. Value
About This Home
This home is located at 43 Maple St, Easthampton, MA 01027 and is currently estimated at $437,063, approximately $228 per square foot. 43 Maple St is a home located in Hampshire County with nearby schools including Easthampton High School, Tri-County Schools, and New England Adolescent Research Institute.
Ownership History
Date
Name
Owned For
Owner Type
Purchase Details
Closed on
Apr 18, 2023
Sold by
Speed Douglas Est
Bought by
Speed Pamela D
Current Estimated Value
Purchase Details
Closed on
May 25, 2004
Sold by
Speed Douglas A and Speed Pamela
Bought by
Speed Douglas A
Home Financials for this Owner
Home Financials are based on the most recent Mortgage that was taken out on this home.
Original Mortgage
$100,000
Interest Rate
5.75%
Mortgage Type
Purchase Money Mortgage
Create a Home Valuation Report for This Property
The Home Valuation Report is an in-depth analysis detailing your home's value as well as a comparison with similar homes in the area
Home Values in the Area
Average Home Value in this Area
Purchase History
| Date | Buyer | Sale Price | Title Company |
|---|---|---|---|
| Speed Pamela D | -- | None Available | |
| Speed Douglas A | $82,500 | -- |
Source: Public Records
Mortgage History
| Date | Status | Borrower | Loan Amount |
|---|---|---|---|
| Previous Owner | Speed Douglas A | $100,000 | |
| Previous Owner | Speed Douglas A | $10,000 | |
| Previous Owner | Speed Douglas A | $16,500 |
Source: Public Records
Tax History
| Year | Tax Paid | Tax Assessment Tax Assessment Total Assessment is a certain percentage of the fair market value that is determined by local assessors to be the total taxable value of land and additions on the property. | Land | Improvement |
|---|---|---|---|---|
| 2025 | $5,099 | $373,000 | $105,700 | $267,300 |
| 2024 | $4,920 | $362,800 | $102,500 | $260,300 |
| 2023 | $3,671 | $250,600 | $80,900 | $169,700 |
| 2022 | $4,142 | $250,600 | $80,900 | $169,700 |
| 2021 | $4,548 | $259,300 | $80,900 | $178,400 |
| 2020 | $102 | $250,600 | $80,900 | $169,700 |
| 2019 | $99 | $234,900 | $80,900 | $154,000 |
| 2018 | $3,491 | $218,200 | $76,400 | $141,800 |
| 2017 | $97 | $209,900 | $73,400 | $136,500 |
| 2016 | $3,246 | $208,200 | $73,400 | $134,800 |
| 2015 | $3,154 | $208,200 | $73,400 | $134,800 |
Source: Public Records
Map
Nearby Homes
- 33 Knipfer Ave
- 4 Gaugh St
- 2 Oak St
- 40 Clark St
- 19 Nicols Way Unit 19
- 7 Union Ct
- 12 Glen Cove Place Unit B
- 10 Glen Cove Place Unit A
- 18-20 Oakdale Place
- 11 Dragon Cir
- 6 Wilton Rd
- 41 South St Unit 11
- 336 Main St
- 385 Main St
- M143 &152 Glendale St
- 6 S St & Abutting Lots
- 2 W Park Dr
- 36 & 36R Holly Cir
- 131 West St Unit 131
- 211 East St Unit 11
Your Personal Tour Guide
Ask me questions while you tour the home.