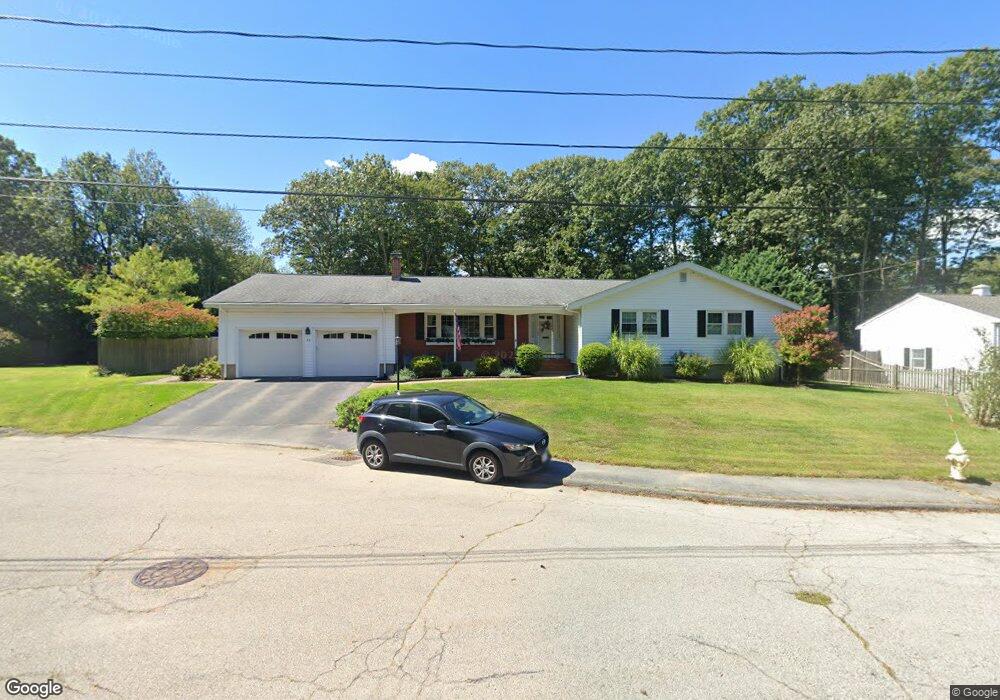
43 Marisa Dr Braintree, MA 02184
Braintree Highlands NeighborhoodEstimated Value: $973,000 - $1,268,000
4
Beds
4
Baths
3,384
Sq Ft
$339/Sq Ft
Est. Value
About This Home
This home is located at 43 Marisa Dr, Braintree, MA 02184 and is currently estimated at $1,146,774, approximately $338 per square foot. 43 Marisa Dr is a home located in Norfolk County with nearby schools including Braintree High School, Boston Higashi School, and Lighthouse Baptist Christian Academy.
Ownership History
Date
Name
Owned For
Owner Type
Purchase Details
Closed on
Dec 10, 2025
Sold by
Orourke Daniel and Orourke Susan
Bought by
Orourke Ft and Orourke
Current Estimated Value
Purchase Details
Closed on
Jul 28, 1993
Sold by
Berman Stnaley G and Berman Sandra W
Bought by
Orourke David and Orourke Susan
Home Financials for this Owner
Home Financials are based on the most recent Mortgage that was taken out on this home.
Original Mortgage
$125,000
Interest Rate
7.32%
Mortgage Type
Purchase Money Mortgage
Create a Home Valuation Report for This Property
The Home Valuation Report is an in-depth analysis detailing your home's value as well as a comparison with similar homes in the area
Home Values in the Area
Average Home Value in this Area
Purchase History
| Date | Buyer | Sale Price | Title Company |
|---|---|---|---|
| Orourke Ft | -- | -- | |
| Orourke David | $287,000 | -- | |
| Orourke David | $287,000 | -- |
Source: Public Records
Mortgage History
| Date | Status | Borrower | Loan Amount |
|---|---|---|---|
| Previous Owner | Orourke David | $125,000 | |
| Previous Owner | Orourke David | $138,000 |
Source: Public Records
Tax History
| Year | Tax Paid | Tax Assessment Tax Assessment Total Assessment is a certain percentage of the fair market value that is determined by local assessors to be the total taxable value of land and additions on the property. | Land | Improvement |
|---|---|---|---|---|
| 2025 | $9,604 | $962,300 | $417,200 | $545,100 |
| 2024 | $8,704 | $918,100 | $384,300 | $533,800 |
| 2023 | $8,338 | $854,300 | $351,400 | $502,900 |
| 2022 | $8,062 | $810,300 | $307,400 | $502,900 |
| 2021 | $7,460 | $749,700 | $277,800 | $471,900 |
| 2020 | $7,129 | $723,000 | $252,500 | $470,500 |
| 2019 | $6,835 | $677,400 | $252,500 | $424,900 |
| 2018 | $6,629 | $628,900 | $219,600 | $409,300 |
| 2017 | $6,636 | $617,900 | $208,600 | $409,300 |
| 2016 | $6,552 | $596,700 | $197,600 | $399,100 |
| 2015 | $6,558 | $592,400 | $193,300 | $399,100 |
| 2014 | $5,937 | $519,900 | $168,000 | $351,900 |
Source: Public Records
Map
Nearby Homes
- 44 Arlington Ave
- 1579 Washington St
- 15 Alida Rd
- 1696 Liberty St
- 39 Canavan Dr
- 70 Alida Rd
- 129 Albee Dr
- 661 North St
- 700 North St
- 61 Grove St
- 55 Bradford Commons Ln Unit 55
- 30 Thetford Ave
- 278 N Franklin St
- 972 Liberty St
- 219 Allerton Commons Ln
- 18 Brewster Rd
- 145 Hancock St Unit 307
- 184 Belcher St
- 29 Saint Michael Rd
- 6 Lunar Ave