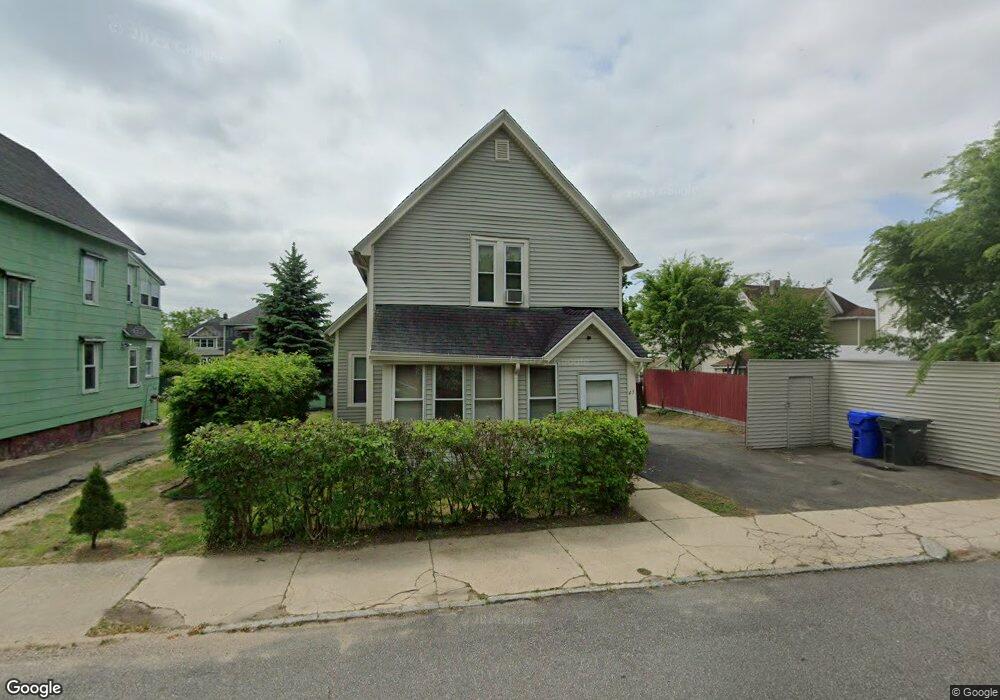
43 Marshall St Springfield, MA 01109
Old Hill NeighborhoodEstimated Value: $261,480 - $301,000
4
Beds
1
Bath
1,572
Sq Ft
$178/Sq Ft
Est. Value
About This Home
This home is located at 43 Marshall St, Springfield, MA 01109 and is currently estimated at $279,120, approximately $177 per square foot. 43 Marshall St is a home located in Hampden County with nearby schools including Elias Brookings School, M Marcus Kiley Middle, and High School Of Commerce.
Ownership History
Date
Name
Owned For
Owner Type
Purchase Details
Closed on
Aug 17, 2020
Sold by
Ware Frank
Bought by
Red Rock Management Llc
Current Estimated Value
Home Financials for this Owner
Home Financials are based on the most recent Mortgage that was taken out on this home.
Original Mortgage
$110,000
Outstanding Balance
$97,138
Interest Rate
3%
Mortgage Type
New Conventional
Estimated Equity
$181,982
Purchase Details
Closed on
Sep 4, 2015
Sold by
Ware Frank
Bought by
Ware Frank
Purchase Details
Closed on
May 12, 2005
Sold by
Ware Denice C
Bought by
Ware Frank
Home Financials for this Owner
Home Financials are based on the most recent Mortgage that was taken out on this home.
Original Mortgage
$71,250
Interest Rate
6.05%
Mortgage Type
Purchase Money Mortgage
Purchase Details
Closed on
Mar 2, 1993
Sold by
Trombley Azelina S
Bought by
Ware Frank and Ware Denice C
Create a Home Valuation Report for This Property
The Home Valuation Report is an in-depth analysis detailing your home's value as well as a comparison with similar homes in the area
Home Values in the Area
Average Home Value in this Area
Purchase History
| Date | Buyer | Sale Price | Title Company |
|---|---|---|---|
| Red Rock Management Llc | -- | None Available | |
| Ware Frank | -- | -- | |
| Ware Frank | -- | -- | |
| Ware Frank | -- | -- | |
| Ware Frank | $33,500 | -- |
Source: Public Records
Mortgage History
| Date | Status | Borrower | Loan Amount |
|---|---|---|---|
| Open | Red Rock Management Llc | $110,000 | |
| Previous Owner | Ware Frank | $71,250 |
Source: Public Records
Tax History
| Year | Tax Paid | Tax Assessment Tax Assessment Total Assessment is a certain percentage of the fair market value that is determined by local assessors to be the total taxable value of land and additions on the property. | Land | Improvement |
|---|---|---|---|---|
| 2025 | $3,834 | $244,500 | $24,800 | $219,700 |
| 2024 | $2,794 | $174,000 | $23,100 | $150,900 |
| 2023 | $2,956 | $173,400 | $22,000 | $151,400 |
| 2022 | $2,930 | $155,700 | $20,000 | $135,700 |
| 2021 | $2,306 | $122,000 | $18,200 | $103,800 |
| 2020 | $2,275 | $116,500 | $18,200 | $98,300 |
| 2019 | $2,179 | $110,700 | $18,200 | $92,500 |
| 2018 | $1,887 | $95,900 | $18,200 | $77,700 |
| 2017 | $2,007 | $102,100 | $14,600 | $87,500 |
| 2016 | $1,909 | $97,100 | $14,600 | $82,500 |
| 2015 | $1,884 | $95,800 | $14,600 | $81,200 |
Source: Public Records
Map
Nearby Homes
- 49 Marshall St
- 38 Melrose St
- 32 Melrose St Unit 34
- 53 Marshall St
- 66 Melrose St
- 42 Melrose St
- 72 Melrose St
- 46 Melrose St
- 59 Marshall St
- 91 Melrose St Unit 1 and 2
- 52 Marshall St
- 69 Marshall St
- 40 Marshall St
- 67 Melrose St Unit 69
- 60 Marshall St
- 88 Melrose St
- 34 Marshall St
- 73 Melrose St Unit 75
- 16 Melrose St
- 30 Marshall St
Your Personal Tour Guide
Ask me questions while you tour the home.