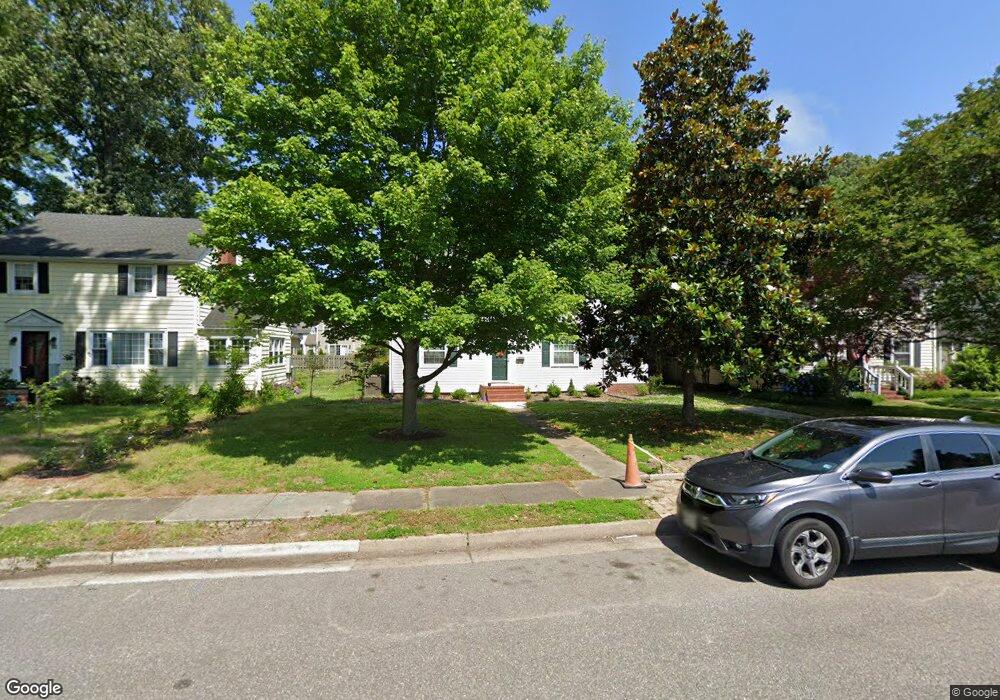
43 Milford Rd Newport News, VA 23601
Brandon Heights NeighborhoodEstimated Value: $290,000 - $340,000
3
Beds
2
Baths
2,014
Sq Ft
$158/Sq Ft
Est. Value
About This Home
This home is located at 43 Milford Rd, Newport News, VA 23601 and is currently estimated at $317,307, approximately $157 per square foot. 43 Milford Rd is a home located in Newport News City with nearby schools including Hilton Elementary School, Homer L. Hines Middle School, and Warwick High School.
Ownership History
Date
Name
Owned For
Owner Type
Purchase Details
Closed on
Jun 26, 2020
Sold by
Cochran Luci and Cochran James
Bought by
Ratliff Alexandra L
Current Estimated Value
Home Financials for this Owner
Home Financials are based on the most recent Mortgage that was taken out on this home.
Original Mortgage
$208,453
Outstanding Balance
$184,016
Interest Rate
3.1%
Mortgage Type
New Conventional
Estimated Equity
$133,291
Create a Home Valuation Report for This Property
The Home Valuation Report is an in-depth analysis detailing your home's value as well as a comparison with similar homes in the area
Home Values in the Area
Average Home Value in this Area
Purchase History
| Date | Buyer | Sale Price | Title Company |
|---|---|---|---|
| Ratliff Alexandra L | $214,900 | Attorney |
Source: Public Records
Mortgage History
| Date | Status | Borrower | Loan Amount |
|---|---|---|---|
| Open | Ratliff Alexandra L | $208,453 |
Source: Public Records
Tax History Compared to Growth
Tax History
| Year | Tax Paid | Tax Assessment Tax Assessment Total Assessment is a certain percentage of the fair market value that is determined by local assessors to be the total taxable value of land and additions on the property. | Land | Improvement |
|---|---|---|---|---|
| 2025 | $3,493 | $291,400 | $88,000 | $203,400 |
| 2024 | $3,346 | $283,600 | $88,000 | $195,600 |
| 2023 | $3,384 | $274,300 | $88,000 | $186,300 |
| 2022 | $3,169 | $251,800 | $88,000 | $163,800 |
| 2021 | $2,727 | $223,500 | $80,000 | $143,500 |
| 2020 | $2,832 | $220,100 | $80,000 | $140,100 |
| 2019 | $2,762 | $214,700 | $80,000 | $134,700 |
| 2018 | $2,727 | $212,100 | $80,000 | $132,100 |
| 2017 | $2,650 | $205,800 | $80,000 | $125,800 |
| 2016 | $2,646 | $205,800 | $80,000 | $125,800 |
| 2015 | $2,640 | $205,800 | $80,000 | $125,800 |
| 2014 | $2,287 | $202,900 | $80,000 | $122,900 |
Source: Public Records
Map
Nearby Homes