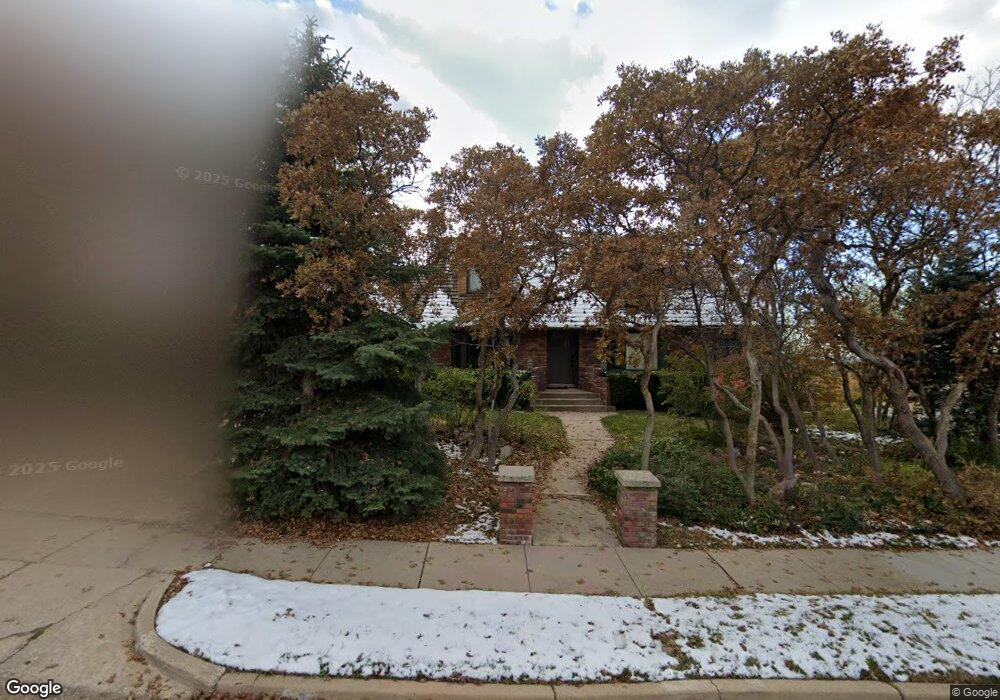
43 N 3175 E Layton, UT 84040
Estimated Value: $775,000 - $935,000
4
Beds
3
Baths
4,196
Sq Ft
$201/Sq Ft
Est. Value
About This Home
This home is located at 43 N 3175 E, Layton, UT 84040 and is currently estimated at $844,187, approximately $201 per square foot. 43 N 3175 E is a home located in Davis County with nearby schools including Morgan Elementary School, Fairfield Junior High School, and Layton High School.
Ownership History
Date
Name
Owned For
Owner Type
Purchase Details
Closed on
Mar 19, 2021
Sold by
Condie Dale and Condie Chelsey
Bought by
Condie Dale
Current Estimated Value
Purchase Details
Closed on
Jan 29, 2019
Sold by
Condie Dale
Bought by
Condie Dale and Condie Chelsey
Home Financials for this Owner
Home Financials are based on the most recent Mortgage that was taken out on this home.
Original Mortgage
$408,500
Outstanding Balance
$356,236
Interest Rate
4.5%
Mortgage Type
New Conventional
Estimated Equity
$487,951
Purchase Details
Closed on
May 23, 2011
Sold by
The Association Of Unit Owners Of Tangle
Bought by
Bowen Robert L
Create a Home Valuation Report for This Property
The Home Valuation Report is an in-depth analysis detailing your home's value as well as a comparison with similar homes in the area
Home Values in the Area
Average Home Value in this Area
Purchase History
| Date | Buyer | Sale Price | Title Company |
|---|---|---|---|
| Condie Dale | -- | None Available | |
| Condie Dale | -- | Accommodation | |
| Condie Dale | -- | Old Republic Title | |
| Bowen Robert L | -- | None Available |
Source: Public Records
Mortgage History
| Date | Status | Borrower | Loan Amount |
|---|---|---|---|
| Open | Condie Dale | $408,500 |
Source: Public Records
Tax History
| Year | Tax Paid | Tax Assessment Tax Assessment Total Assessment is a certain percentage of the fair market value that is determined by local assessors to be the total taxable value of land and additions on the property. | Land | Improvement |
|---|---|---|---|---|
| 2025 | $3,825 | $401,500 | $197,838 | $203,662 |
| 2024 | $3,459 | $365,750 | $210,104 | $155,646 |
| 2023 | $3,487 | $650,000 | $234,341 | $415,659 |
| 2022 | $3,608 | $365,200 | $117,556 | $247,644 |
| 2021 | $3,425 | $517,000 | $162,747 | $354,253 |
| 2020 | $3,163 | $458,000 | $155,664 | $302,336 |
| 2019 | $3,060 | $434,000 | $151,401 | $282,599 |
| 2018 | $2,851 | $406,000 | $140,186 | $265,814 |
| 2016 | $2,079 | $203,390 | $33,055 | $170,335 |
| 2015 | $2,714 | $189,255 | $33,055 | $156,200 |
| 2014 | $1,784 | $176,820 | $33,055 | $143,765 |
| 2013 | -- | $159,500 | $33,055 | $126,445 |
Source: Public Records
Map
Nearby Homes
- 133 Blue Sage Ln
- 1463 Stone House Bend Unit 405
- 1423 Stone House Bend Unit 403
- 1406 Stone House Bend Unit 413
- 1494 Orchard Ridge Ln Unit 315
- 1390 Orchard Ridge Ln
- 1202 E Mutton Hollow Rd
- 378 N Thurston Ln
- 717 Woodridge Dr
- 882 E Windsor Ln N
- 1048 N Kensington Heights
- 1285 E Grantham Way
- 2382 Summerwood Dr
- 815 E Oxford Dr
- 2855 E Gentile St Unit 1
- 1365 E Oakmont Ln
- 888 Thornfield Rd
- 1357 E 650 N
- 660 N 1340 E Unit 8
- 799 E Westbrook Rd
Your Personal Tour Guide
Ask me questions while you tour the home.