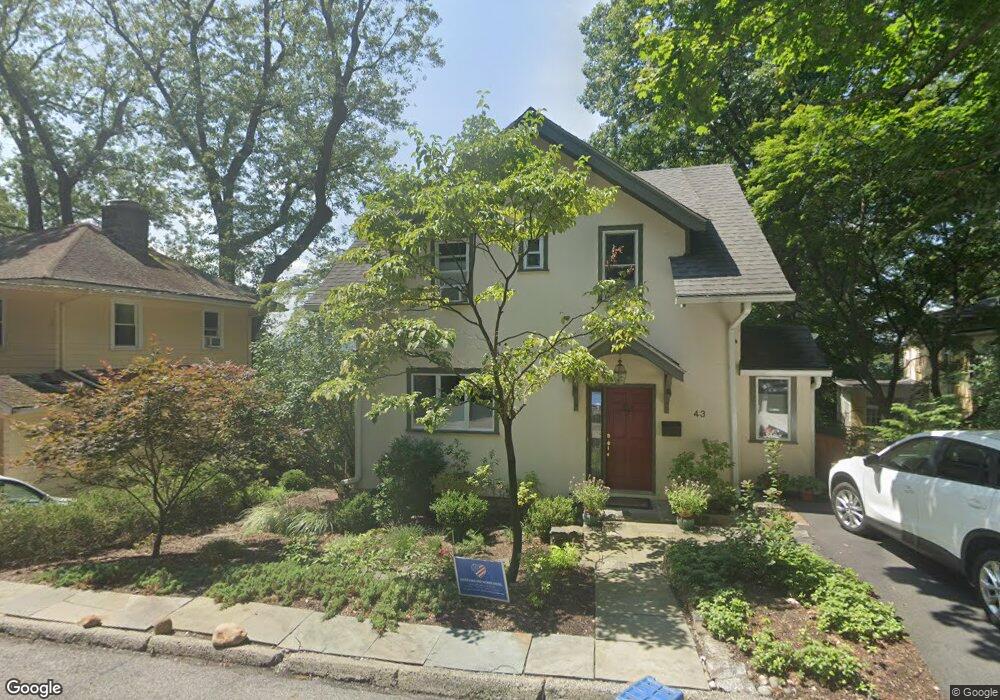
43 N Driveway Dobbs Ferry, NY 10522
Estimated Value: $1,523,930 - $1,755,000
3
Beds
3
Baths
2,204
Sq Ft
$725/Sq Ft
Est. Value
About This Home
This home is located at 43 N Driveway, Dobbs Ferry, NY 10522 and is currently estimated at $1,597,983, approximately $725 per square foot. 43 N Driveway is a home located in Westchester County with nearby schools including Springhurst Elementary School, Dobbs Ferry High School, and The Masters School.
Ownership History
Date
Name
Owned For
Owner Type
Purchase Details
Closed on
Sep 17, 2024
Sold by
Bregman Steven M and Intner Carol F
Bought by
Simmonds James A E and Causon Lauren O
Current Estimated Value
Home Financials for this Owner
Home Financials are based on the most recent Mortgage that was taken out on this home.
Original Mortgage
$550,000
Outstanding Balance
$542,775
Interest Rate
6.49%
Mortgage Type
New Conventional
Estimated Equity
$1,055,208
Purchase Details
Closed on
May 26, 2011
Sold by
Higgins Joel F and Higgins Stacey A
Bought by
Bregman Steven M and Intner Carol F
Home Financials for this Owner
Home Financials are based on the most recent Mortgage that was taken out on this home.
Original Mortgage
$696,750
Interest Rate
4.81%
Mortgage Type
New Conventional
Purchase Details
Closed on
Jun 24, 1999
Sold by
Quinlan Robert and Robstock Quinlan Alice M
Bought by
Bank United
Create a Home Valuation Report for This Property
The Home Valuation Report is an in-depth analysis detailing your home's value as well as a comparison with similar homes in the area
Home Values in the Area
Average Home Value in this Area
Purchase History
| Date | Buyer | Sale Price | Title Company |
|---|---|---|---|
| Simmonds James A E | $1,410,000 | Judicial Title | |
| Bregman Steven M | $930,000 | Stewart Title Insurance Co | |
| Bank United | $225,000 | -- |
Source: Public Records
Mortgage History
| Date | Status | Borrower | Loan Amount |
|---|---|---|---|
| Open | Simmonds James A E | $550,000 | |
| Previous Owner | Bregman Steven M | $696,750 |
Source: Public Records
Tax History
| Year | Tax Paid | Tax Assessment Tax Assessment Total Assessment is a certain percentage of the fair market value that is determined by local assessors to be the total taxable value of land and additions on the property. | Land | Improvement |
|---|---|---|---|---|
| 2024 | $40,624 | $1,315,000 | $702,100 | $612,900 |
| 2023 | $39,642 | $1,311,300 | $621,300 | $690,000 |
| 2022 | $37,500 | $1,254,300 | $621,300 | $633,000 |
| 2021 | $35,538 | $1,140,300 | $621,300 | $519,000 |
| 2020 | $34,930 | $1,044,500 | $630,000 | $414,500 |
| 2019 | $33,645 | $1,044,500 | $630,000 | $414,500 |
| 2018 | $41,023 | $1,015,200 | $630,000 | $385,200 |
| 2017 | $4,434 | $1,015,200 | $630,000 | $385,200 |
| 2016 | $800,704 | $976,200 | $630,000 | $346,200 |
| 2015 | -- | $27,850 | $2,550 | $25,300 |
| 2014 | -- | $27,850 | $2,550 | $25,300 |
| 2013 | -- | $26,350 | $2,550 | $23,800 |
Source: Public Records
Map
Nearby Homes
- 80 Broadway
- 177 Clinton Ave
- 16 Fairlawn Ave
- 751 N Broadway Unit 2D
- 9 Constance Ave
- 182 Broadway
- 234 Judson Ave
- 18 Eldredge Place
- 11 Fairlawn Ave
- 33 Livingston Ave
- 25 Croton Ave
- 565 Broadway Unit 4A
- 565 Broadway Unit 4F
- 555 Broadway Unit 4F
- 49 Maple Ave Unit 3A
- 31 Maple Ave Unit 2A
- 27 Maple Ave Unit 3B
- 156 Palisade St Unit A
- 156 Palisade St Unit C
- 14 Manor House Dr Unit G29
Your Personal Tour Guide
Ask me questions while you tour the home.