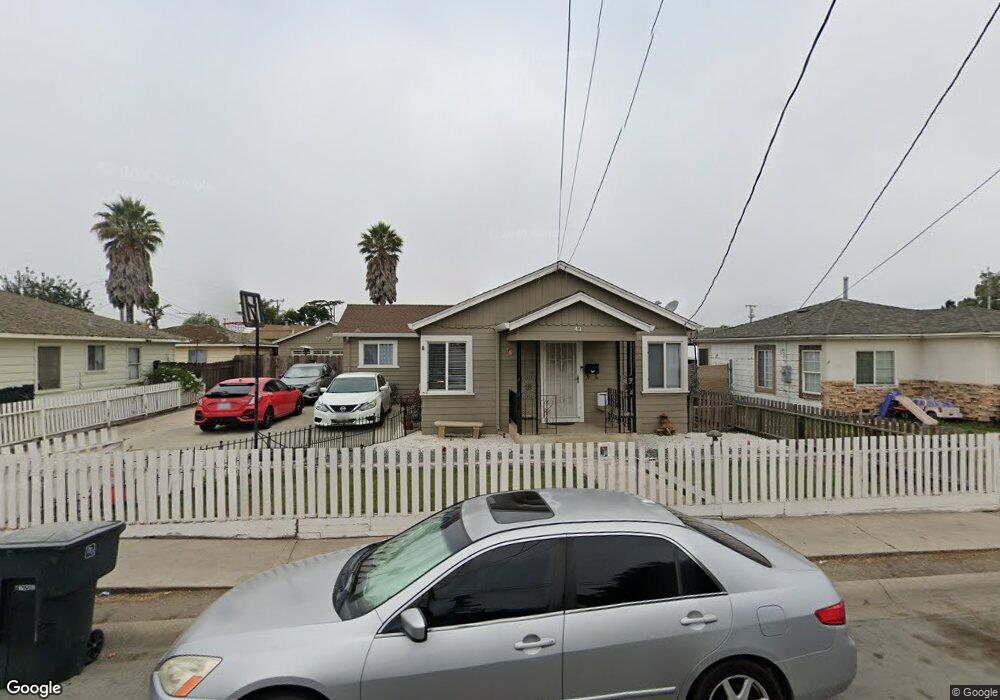
43 N Filice St Salinas, CA 93905
East Salinas NeighborhoodEstimated Value: $564,000 - $660,000
3
Beds
2
Baths
1,398
Sq Ft
$444/Sq Ft
Est. Value
About This Home
This home is located at 43 N Filice St, Salinas, CA 93905 and is currently estimated at $620,699, approximately $443 per square foot. 43 N Filice St is a home located in Monterey County with nearby schools including Sherwood Elementary School, Los Padres Elementary School, and Washington Middle School.
Ownership History
Date
Name
Owned For
Owner Type
Purchase Details
Closed on
Feb 21, 2013
Sold by
Velasquez Cruz G
Bought by
Velasquez Cruz G
Current Estimated Value
Home Financials for this Owner
Home Financials are based on the most recent Mortgage that was taken out on this home.
Original Mortgage
$154,000
Interest Rate
3.36%
Mortgage Type
New Conventional
Purchase Details
Closed on
May 11, 2001
Sold by
Velasquez Leonard A
Bought by
Velasquez Cruz G
Home Financials for this Owner
Home Financials are based on the most recent Mortgage that was taken out on this home.
Original Mortgage
$145,000
Interest Rate
7.15%
Create a Home Valuation Report for This Property
The Home Valuation Report is an in-depth analysis detailing your home's value as well as a comparison with similar homes in the area
Home Values in the Area
Average Home Value in this Area
Purchase History
| Date | Buyer | Sale Price | Title Company |
|---|---|---|---|
| Velasquez Cruz G | -- | First American Title Company | |
| Velasquez Cruz G | -- | Stewart Title |
Source: Public Records
Mortgage History
| Date | Status | Borrower | Loan Amount |
|---|---|---|---|
| Closed | Velasquez Cruz G | $154,000 | |
| Closed | Velasquez Cruz G | $145,000 |
Source: Public Records
Tax History
| Year | Tax Paid | Tax Assessment Tax Assessment Total Assessment is a certain percentage of the fair market value that is determined by local assessors to be the total taxable value of land and additions on the property. | Land | Improvement |
|---|---|---|---|---|
| 2025 | $1,343 | $113,162 | $33,939 | $79,223 |
| 2024 | $1,343 | $110,944 | $33,274 | $77,670 |
| 2023 | $1,298 | $108,770 | $32,622 | $76,148 |
| 2022 | $1,248 | $106,638 | $31,983 | $74,655 |
| 2021 | $1,200 | $104,548 | $31,356 | $73,192 |
| 2020 | $1,167 | $103,477 | $31,035 | $72,442 |
| 2019 | $1,157 | $101,449 | $30,427 | $71,022 |
| 2018 | $1,140 | $99,461 | $29,831 | $69,630 |
| 2017 | $1,140 | $97,512 | $29,247 | $68,265 |
| 2016 | $1,141 | $95,601 | $28,674 | $66,927 |
| 2015 | $1,150 | $94,166 | $28,244 | $65,922 |
| 2014 | $1,076 | $92,322 | $27,691 | $64,631 |
Source: Public Records
Map
Nearby Homes
- 129 N Filice St
- 78 Ragsdale Ct
- 320 N Sanborn Rd
- 487 E Market St
- 724 Circle Dr
- 544 Saint George Dr
- 150 Kern St Unit 114
- 150 Kern St Unit 40
- 158 Kern St Unit 11
- 166 Kern St Unit 19
- 166 Kern St Unit 18
- 166 Kern St Unit 26
- 182 Kern St Unit 45
- 11 Hill Cir
- 190 Kern St Unit 48
- 609 Saint George Dr
- 11 E Laurel Dr
- 933 Acosta Plaza Unit 35
- 234 Cherry Dr
- 1 Santa Lucia Ave
Your Personal Tour Guide
Ask me questions while you tour the home.