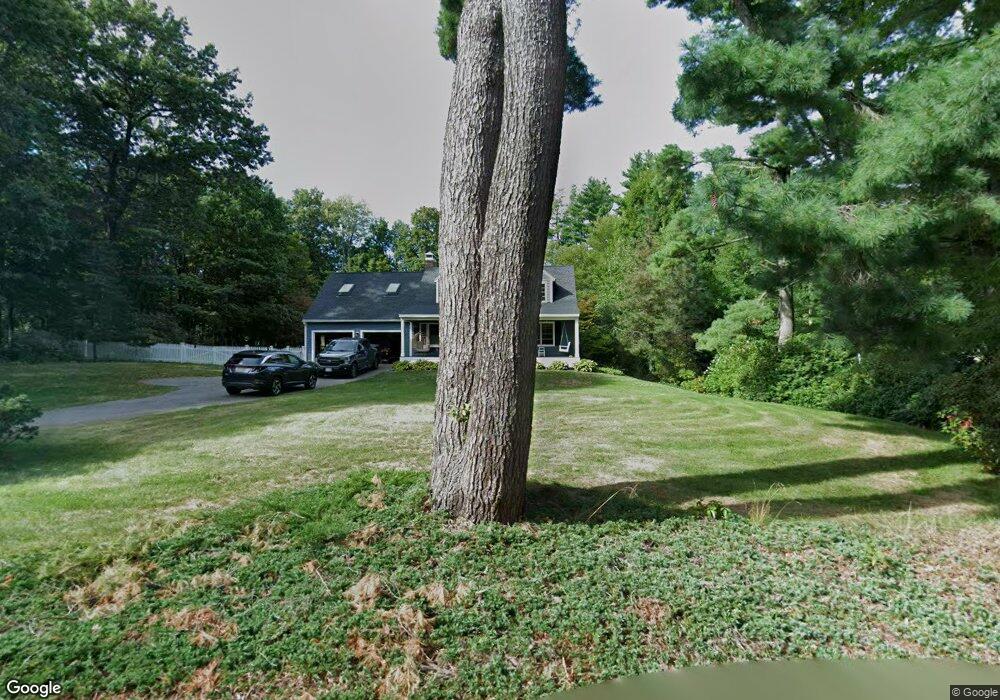
43 Orchard Dr Hollis, NH 03049
Hollis NeighborhoodEstimated Value: $888,878 - $927,000
3
Beds
3
Baths
2,881
Sq Ft
$317/Sq Ft
Est. Value
About This Home
This home is located at 43 Orchard Dr, Hollis, NH 03049 and is currently estimated at $913,220, approximately $316 per square foot. 43 Orchard Dr is a home with nearby schools including Hollis Primary School, Hollis Upper Elementary School, and Hollis-Brookline Middle School.
Ownership History
Date
Name
Owned For
Owner Type
Purchase Details
Closed on
Jun 18, 2019
Sold by
Buzzy Christopher J and Buzzy Mary C
Bought by
Hecker Ezekiel P and Hecker Kara A
Current Estimated Value
Home Financials for this Owner
Home Financials are based on the most recent Mortgage that was taken out on this home.
Original Mortgage
$468,000
Outstanding Balance
$410,652
Interest Rate
4%
Mortgage Type
New Conventional
Estimated Equity
$502,568
Purchase Details
Closed on
Sep 14, 1998
Sold by
Loughlin Bruce J and Loughlin Janet B
Bought by
Buzzy Christopher J and Buzzy Mary C
Home Financials for this Owner
Home Financials are based on the most recent Mortgage that was taken out on this home.
Original Mortgage
$214,700
Interest Rate
6.92%
Mortgage Type
Purchase Money Mortgage
Create a Home Valuation Report for This Property
The Home Valuation Report is an in-depth analysis detailing your home's value as well as a comparison with similar homes in the area
Home Values in the Area
Average Home Value in this Area
Purchase History
| Date | Buyer | Sale Price | Title Company |
|---|---|---|---|
| Hecker Ezekiel P | $585,000 | -- | |
| Buzzy Christopher J | $226,000 | -- |
Source: Public Records
Mortgage History
| Date | Status | Borrower | Loan Amount |
|---|---|---|---|
| Open | Hecker Ezekiel P | $468,000 | |
| Previous Owner | Buzzy Christopher J | $150,000 | |
| Previous Owner | Buzzy Christopher J | $150,000 | |
| Previous Owner | Buzzy Christopher J | $214,700 |
Source: Public Records
Tax History Compared to Growth
Tax History
| Year | Tax Paid | Tax Assessment Tax Assessment Total Assessment is a certain percentage of the fair market value that is determined by local assessors to be the total taxable value of land and additions on the property. | Land | Improvement |
|---|---|---|---|---|
| 2024 | $12,881 | $726,500 | $273,400 | $453,100 |
| 2023 | $12,103 | $726,500 | $273,400 | $453,100 |
| 2022 | $16,397 | $726,500 | $273,400 | $453,100 |
| 2021 | $10,267 | $452,300 | $175,100 | $277,200 |
| 2020 | $10,484 | $452,300 | $175,100 | $277,200 |
| 2019 | $10,448 | $452,300 | $175,100 | $277,200 |
| 2018 | $9,801 | $452,300 | $175,100 | $277,200 |
| 2017 | $8,855 | $382,500 | $137,100 | $245,400 |
| 2016 | $8,962 | $382,500 | $137,100 | $245,400 |
| 2015 | $8,805 | $382,500 | $137,100 | $245,400 |
| 2014 | $8,847 | $382,500 | $137,100 | $245,400 |
| 2013 | $8,715 | $381,900 | $137,100 | $244,800 |
Source: Public Records
Map
Nearby Homes