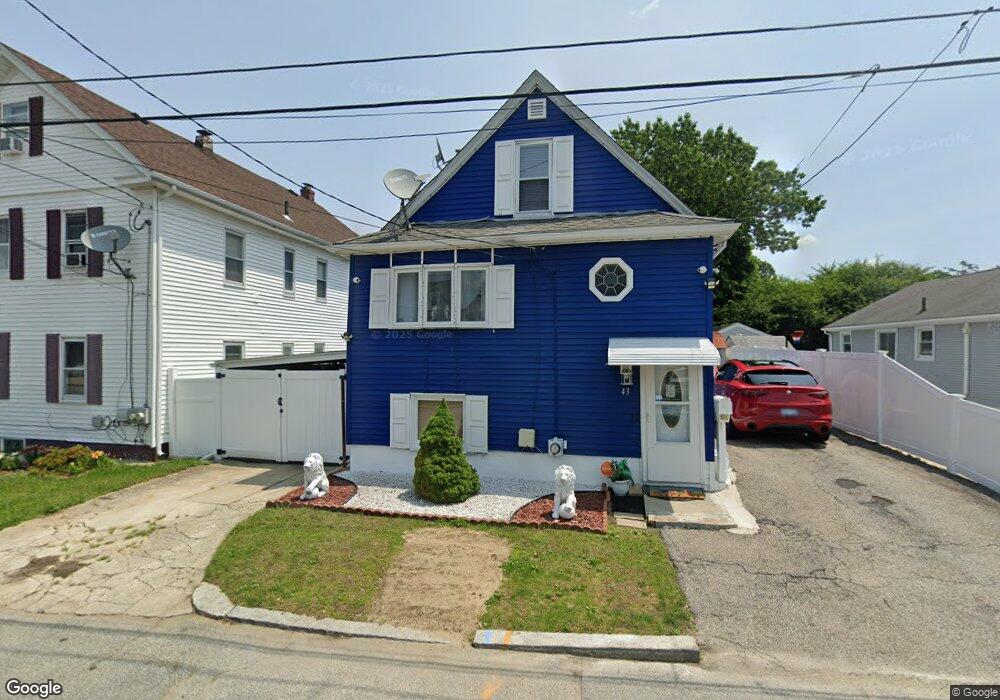
43 Pendleton St Cranston, RI 02920
Village NeighborhoodEstimated Value: $342,000 - $388,000
2
Beds
2
Baths
1,170
Sq Ft
$307/Sq Ft
Est. Value
About This Home
This home is located at 43 Pendleton St, Cranston, RI 02920 and is currently estimated at $358,885, approximately $306 per square foot. 43 Pendleton St is a home located in Providence County with nearby schools including Arlington Elementary School, Hugh B. Bain Middle School, and Cranston High School East.
Ownership History
Date
Name
Owned For
Owner Type
Purchase Details
Closed on
Aug 24, 2018
Sold by
Jimenez Iris A
Bought by
Pablu Reilly R
Current Estimated Value
Home Financials for this Owner
Home Financials are based on the most recent Mortgage that was taken out on this home.
Original Mortgage
$156,120
Outstanding Balance
$133,247
Interest Rate
4.12%
Mortgage Type
FHA
Estimated Equity
$225,638
Purchase Details
Closed on
Apr 1, 2010
Sold by
Jp Morgan Mtg
Bought by
Jimenez Iris A
Home Financials for this Owner
Home Financials are based on the most recent Mortgage that was taken out on this home.
Original Mortgage
$101,134
Interest Rate
5.25%
Mortgage Type
FHA
Purchase Details
Closed on
Oct 26, 2009
Sold by
Mcinerney Ronald and Mcinerney Karen
Bought by
Jp Morgan Chase Mtg
Purchase Details
Closed on
Mar 1, 2007
Sold by
Wells Fargo Bk Na
Bought by
Mariorenzi Gary
Purchase Details
Closed on
Sep 7, 2006
Sold by
Dunning Shannon
Bought by
Wells Fargo Bk Na
Purchase Details
Closed on
Apr 15, 2005
Sold by
Gates Deborah G
Bought by
Dunning Shannon
Purchase Details
Closed on
Sep 21, 1992
Sold by
Fratazzi Irene M
Bought by
Guastini Deborah G and Guastini James
Create a Home Valuation Report for This Property
The Home Valuation Report is an in-depth analysis detailing your home's value as well as a comparison with similar homes in the area
Home Values in the Area
Average Home Value in this Area
Purchase History
| Date | Buyer | Sale Price | Title Company |
|---|---|---|---|
| Pablu Reilly R | $159,000 | -- | |
| Jimenez Iris A | $103,000 | -- | |
| Jp Morgan Chase Mtg | $104,000 | -- | |
| Mariorenzi Gary | $140,500 | -- | |
| Wells Fargo Bk Na | $174,500 | -- | |
| Dunning Shannon | $216,000 | -- | |
| Guastini Deborah G | $64,000 | -- |
Source: Public Records
Mortgage History
| Date | Status | Borrower | Loan Amount |
|---|---|---|---|
| Open | Guastini Deborah G | $156,120 | |
| Previous Owner | Guastini Deborah G | $101,134 |
Source: Public Records
Tax History
| Year | Tax Paid | Tax Assessment Tax Assessment Total Assessment is a certain percentage of the fair market value that is determined by local assessors to be the total taxable value of land and additions on the property. | Land | Improvement |
|---|---|---|---|---|
| 2025 | $3,562 | $256,600 | $81,500 | $175,100 |
| 2024 | $3,492 | $256,600 | $81,500 | $175,100 |
| 2023 | $3,576 | $189,200 | $56,200 | $133,000 |
| 2022 | $3,502 | $189,200 | $56,200 | $133,000 |
| 2021 | $3,406 | $189,200 | $56,200 | $133,000 |
| 2020 | $3,095 | $149,000 | $43,700 | $105,300 |
| 2019 | $3,095 | $149,000 | $43,700 | $105,300 |
| 2018 | $3,023 | $149,000 | $43,700 | $105,300 |
| 2017 | $2,932 | $127,800 | $34,300 | $93,500 |
| 2016 | $2,869 | $127,800 | $34,300 | $93,500 |
| 2015 | $2,869 | $127,800 | $34,300 | $93,500 |
| 2014 | $2,800 | $122,600 | $34,300 | $88,300 |
Source: Public Records
Map
Nearby Homes
- 41 Pendleton St
- 47 Pendleton St
- 26 Puritan Ave
- 37 Pendleton St
- 48 Pendleton St
- 44 Pendleton St
- 40 Pendleton St
- 31 Pendleton St Unit 33
- 50 Pendleton St
- 1235 Cranston St
- 29 Puritan Ave
- 32 Pendleton St
- 15 Puritan Ave
- 75 Standish Ave
- 67 Standish Ave
- 29 Pendleton St
- 0 Pendleton St
- 28 Pendleton St Unit 30
- 56 Puritan Ave
- 1231 Cranston St
Your Personal Tour Guide
Ask me questions while you tour the home.