
Seller's Agent in 2023
Robert Rinn
RE/MAX Professionals
(401) 633-5788
6 in this area
295 Total Sales
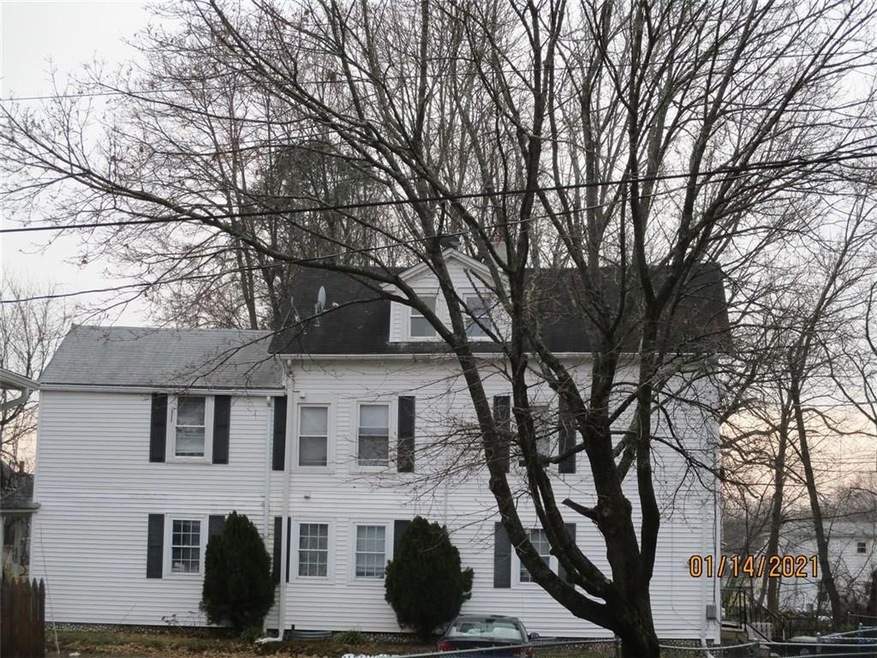
Investors and Owner Occupants, 3-family located in West Warwick. 43 Phenix Ave features two 3-bedroom units and one 1-bedroom. Ample parking and separate utilities.
Last Agent to Sell the Property
RE/MAX Professionals License #RES.0044179 Listed on: 05/31/2023
| Date | Type | Sale Price | Title Company |
|---|---|---|---|
| Warranty Deed | $360,000 | None Available | |
| Warranty Deed | $260,000 | None Available | |
| Deed | $69,000 | -- | |
| Deed | $312,000 | -- | |
| Deed | $205,000 | -- | |
| Deed | $147,000 | -- | |
| Warranty Deed | $57,500 | -- |
| Date | Status | Loan Amount | Loan Type |
|---|---|---|---|
| Open | $345,950 | FHA | |
| Previous Owner | $775,000 | Purchase Money Mortgage | |
| Previous Owner | $115,000 | No Value Available | |
| Previous Owner | $249,360 | Purchase Money Mortgage |
| Date | Event | Price | Change | Sq Ft Price |
|---|---|---|---|---|
| 10/16/2023 10/16/23 | Sold | $360,000 | +2.9% | $141 / Sq Ft |
| 06/05/2023 06/05/23 | Pending | -- | -- | -- |
| 05/31/2023 05/31/23 | For Sale | $349,900 | +34.6% | $137 / Sq Ft |
| 05/26/2023 05/26/23 | Sold | $260,000 | 0.0% | $102 / Sq Ft |
| 04/23/2023 04/23/23 | Pending | -- | -- | -- |
| 04/23/2023 04/23/23 | For Sale | $260,000 | -- | $102 / Sq Ft |
| Year | Tax Paid | Tax Assessment Tax Assessment Total Assessment is a certain percentage of the fair market value that is determined by local assessors to be the total taxable value of land and additions on the property. | Land | Improvement |
|---|---|---|---|---|
| 2025 | $5,699 | $372,700 | $65,900 | $306,800 |
| 2024 | $5,979 | $292,100 | $62,100 | $230,000 |
| 2023 | $5,389 | $268,500 | $62,100 | $206,400 |
| 2022 | $5,303 | $268,500 | $62,100 | $206,400 |
| 2021 | $6,121 | $204,800 | $47,500 | $157,300 |
| 2020 | $6,121 | $204,800 | $47,500 | $157,300 |
| 2019 | $6,005 | $204,800 | $47,500 | $157,300 |
| 2018 | $5,500 | $140,300 | $40,900 | $99,400 |
| 2017 | $5,324 | $140,300 | $40,900 | $99,400 |
| 2016 | $5,229 | $140,300 | $40,900 | $99,400 |
| 2015 | $5,277 | $141,600 | $40,900 | $100,700 |
| 2014 | $5,161 | $141,600 | $40,900 | $100,700 |
Seller's Agent in 2023
Robert Rinn
RE/MAX Professionals
(401) 633-5788
6 in this area
295 Total Sales
Seller's Agent in 2023
Rob Doorley
Doorley Real Estate Inc
(401) 338-7790
2 in this area
57 Total Sales
Buyer's Agent in 2023
Marcus Randolph
eXp Realty
(401) 419-5142
1 in this area
112 Total Sales
Source: State-Wide MLS
MLS Number: 1336589
APN: WWAR-000002-000130-000000
Disclaimer: Certain information contained herein is derived from information provided by parties other than Homes.com. All information provided is deemed reliable, but is not guaranteed to be accurate and should be independently verified.
![]() IDX information is provided exclusively for personal, non-commercial use, and may not be used for any purpose other than to identify prospective properties consumers may be interested in purchasing. Information is deemed reliable but not guaranteed.
IDX information is provided exclusively for personal, non-commercial use, and may not be used for any purpose other than to identify prospective properties consumers may be interested in purchasing. Information is deemed reliable but not guaranteed.
Copyright © 2025 State-Wide MLS, Inc. All rights reserved.