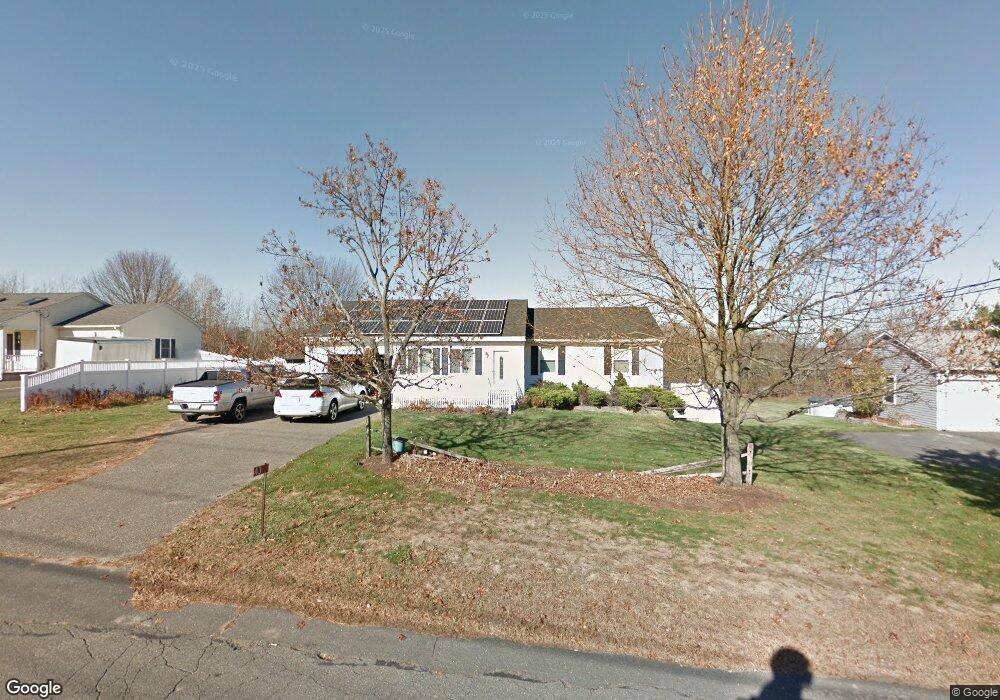
43 Plain St Easthampton, MA 01027
Estimated Value: $417,000 - $458,000
3
Beds
3
Baths
1,460
Sq Ft
$296/Sq Ft
Est. Value
About This Home
This home is located at 43 Plain St, Easthampton, MA 01027 and is currently estimated at $432,842, approximately $296 per square foot. 43 Plain St is a home located in Hampshire County with nearby schools including Easthampton High School, Calvary Baptist Christian School, and Tri-County Schools.
Ownership History
Date
Name
Owned For
Owner Type
Purchase Details
Closed on
Oct 31, 1995
Sold by
Plain Street Rt 4 and Draymore Mark R
Bought by
Smith Robert R and Smith Shirley H
Current Estimated Value
Purchase Details
Closed on
Aug 4, 1995
Sold by
Zalesky Elizabeth E and Zalesky John F
Bought by
Plain St Rt 4 and Draymore Mark R
Purchase Details
Closed on
Mar 22, 1991
Sold by
Fiszer Albert
Bought by
Zalesky John F and Zalesky Elizabeth E
Create a Home Valuation Report for This Property
The Home Valuation Report is an in-depth analysis detailing your home's value as well as a comparison with similar homes in the area
Home Values in the Area
Average Home Value in this Area
Purchase History
| Date | Buyer | Sale Price | Title Company |
|---|---|---|---|
| Smith Robert R | $112,500 | -- | |
| Plain St Rt 4 | $106,000 | -- | |
| Zalesky John F | $119,000 | -- |
Source: Public Records
Mortgage History
| Date | Status | Borrower | Loan Amount |
|---|---|---|---|
| Open | Zalesky John F | $134,000 | |
| Closed | Zalesky John F | $104,000 | |
| Closed | Zalesky John F | $30,000 |
Source: Public Records
Tax History
| Year | Tax Paid | Tax Assessment Tax Assessment Total Assessment is a certain percentage of the fair market value that is determined by local assessors to be the total taxable value of land and additions on the property. | Land | Improvement |
|---|---|---|---|---|
| 2025 | $5,352 | $391,500 | $110,100 | $281,400 |
| 2024 | $5,168 | $381,100 | $106,900 | $274,200 |
| 2023 | $3,884 | $265,100 | $84,300 | $180,800 |
| 2022 | $4,382 | $265,100 | $84,300 | $180,800 |
| 2021 | $4,808 | $274,100 | $84,300 | $189,800 |
| 2020 | $4,708 | $265,100 | $84,300 | $180,800 |
| 2019 | $3,931 | $254,300 | $84,300 | $170,000 |
| 2018 | $3,762 | $235,100 | $79,500 | $155,600 |
| 2017 | $3,675 | $226,700 | $76,500 | $150,200 |
| 2016 | $3,662 | $234,900 | $76,500 | $158,400 |
| 2015 | $3,559 | $234,900 | $76,500 | $158,400 |
Source: Public Records
Map
Nearby Homes
Your Personal Tour Guide
Ask me questions while you tour the home.