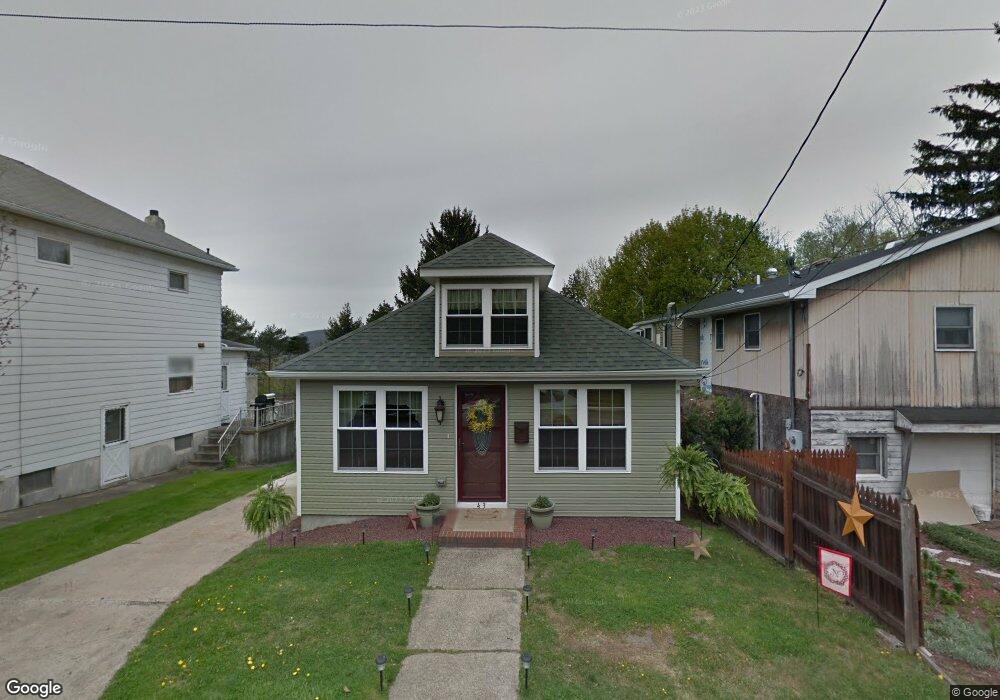
43 Poole St Pittston, PA 18640
Estimated Value: $149,000 - $180,000
2
Beds
1
Bath
1,338
Sq Ft
$119/Sq Ft
Est. Value
About This Home
This home is located at 43 Poole St, Pittston, PA 18640 and is currently estimated at $159,738, approximately $119 per square foot. 43 Poole St is a home located in Luzerne County with nearby schools including Pittston City Intermediate Center, Pittston Area Middle School, and Pittston Area Senior High School.
Ownership History
Date
Name
Owned For
Owner Type
Purchase Details
Closed on
Nov 28, 2014
Sold by
Nocera Louis and Nocera Christine
Bought by
Musto Gloria
Current Estimated Value
Home Financials for this Owner
Home Financials are based on the most recent Mortgage that was taken out on this home.
Original Mortgage
$104,000
Outstanding Balance
$35,907
Interest Rate
3.93%
Mortgage Type
New Conventional
Estimated Equity
$123,831
Purchase Details
Closed on
Mar 31, 2011
Sold by
Menichini Renee
Bought by
Nocera Louis and Nocera Christine
Home Financials for this Owner
Home Financials are based on the most recent Mortgage that was taken out on this home.
Original Mortgage
$116,400
Interest Rate
5.04%
Mortgage Type
New Conventional
Purchase Details
Closed on
Apr 22, 2010
Sold by
Savoia Grace
Bought by
Menichini Renee
Create a Home Valuation Report for This Property
The Home Valuation Report is an in-depth analysis detailing your home's value as well as a comparison with similar homes in the area
Home Values in the Area
Average Home Value in this Area
Purchase History
| Date | Buyer | Sale Price | Title Company |
|---|---|---|---|
| Musto Gloria | $130,000 | None Available | |
| Nocera Louis | $120,000 | None Available | |
| Menichini Renee | $22,000 | None Available |
Source: Public Records
Mortgage History
| Date | Status | Borrower | Loan Amount |
|---|---|---|---|
| Open | Musto Gloria | $104,000 | |
| Previous Owner | Nocera Louis | $116,400 |
Source: Public Records
Tax History Compared to Growth
Tax History
| Year | Tax Paid | Tax Assessment Tax Assessment Total Assessment is a certain percentage of the fair market value that is determined by local assessors to be the total taxable value of land and additions on the property. | Land | Improvement |
|---|---|---|---|---|
| 2025 | $1,664 | $67,100 | $32,700 | $34,400 |
| 2024 | $1,637 | $67,100 | $32,700 | $34,400 |
| 2023 | $1,637 | $67,100 | $32,700 | $34,400 |
| 2022 | $1,591 | $67,100 | $32,700 | $34,400 |
| 2021 | $1,574 | $67,100 | $32,700 | $34,400 |
| 2020 | $1,537 | $67,100 | $32,700 | $34,400 |
| 2019 | $1,524 | $67,100 | $32,700 | $34,400 |
| 2018 | $1,474 | $67,100 | $32,700 | $34,400 |
| 2017 | $1,439 | $67,100 | $32,700 | $34,400 |
| 2016 | -- | $67,100 | $32,700 | $34,400 |
| 2015 | -- | $67,100 | $32,700 | $34,400 |
| 2014 | -- | $67,100 | $32,700 | $34,400 |
Source: Public Records
Map
Nearby Homes