F
Seller's Agent in 2012
Frank Bolway
Stone Wall Real Estate

Estimated Value: $2,108,388 - $2,647,000
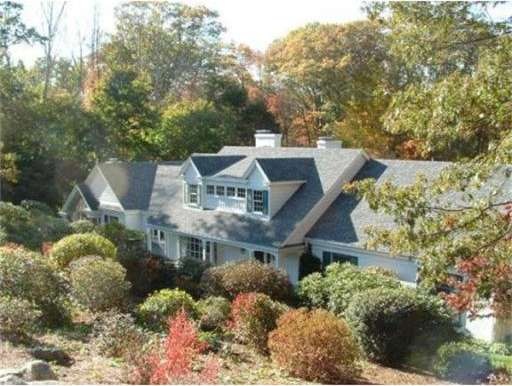
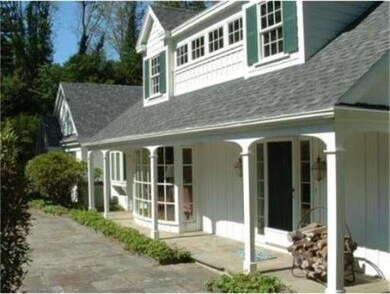
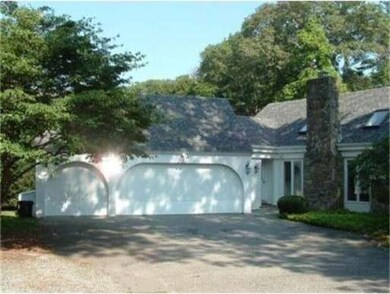
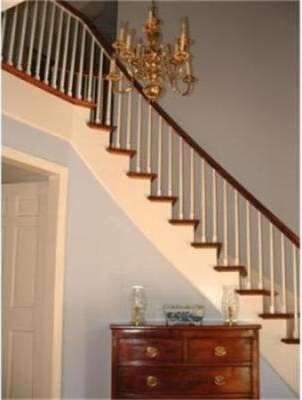
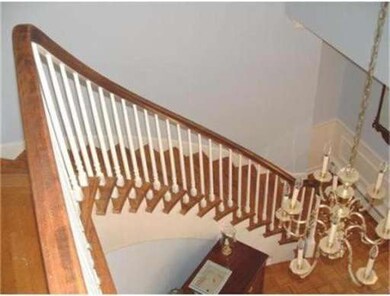
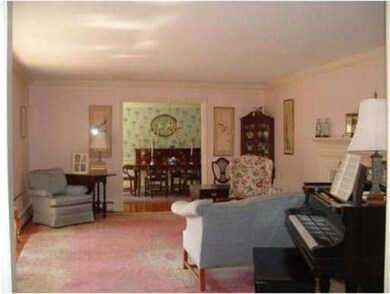
Almost 3 acres of privacy protect this iconic brick and stone Cape near Phillips Academy & Pike School. This 12 RM/6 BR/4.5 BA home is designed for grand entertaining and cozy family living, including 1st and 2nd floor master suites. The back of the house overlooks a heated, gunite pool, lighted tennis court & rolling lawn and perennial gardens. new roof, plus architectural plans by Howell Design are included for Fam Rm, Kit & master bath. bath access from pool/patio area. 6th BR/office/nursery
Last Agent to Sell the Property
Frank Bolway
Stone Wall Real Estate License #456000664 Listed on: 02/16/2012
Last Buyer's Agent
Frank Bolway
Stone Wall Real Estate License #456000664 Listed on: 02/16/2012
Home Type
Single Family
Year Built
1971
Lot Details
0
| Date | Buyer | Sale Price | Title Company |
|---|---|---|---|
| Guthrie Brendon J | $920,000 | -- | |
| 43 Porter Llc | -- | -- |
| Date | Status | Borrower | Loan Amount |
|---|---|---|---|
| Open | Guthrie Brendon J | $735,000 |
| Date | Event | Price | List to Sale | Price per Sq Ft |
|---|---|---|---|---|
| 06/15/2012 06/15/12 | Sold | $920,000 | -3.2% | $162 / Sq Ft |
| 03/03/2012 03/03/12 | Pending | -- | -- | -- |
| 02/16/2012 02/16/12 | For Sale | $950,000 | -- | $168 / Sq Ft |
| Year | Tax Paid | Tax Assessment Tax Assessment Total Assessment is a certain percentage of the fair market value that is determined by local assessors to be the total taxable value of land and additions on the property. | Land | Improvement |
|---|---|---|---|---|
| 2024 | $19,448 | $1,509,900 | $615,000 | $894,900 |
| 2023 | $18,649 | $1,365,200 | $556,600 | $808,600 |
| 2022 | $17,894 | $1,225,600 | $487,800 | $737,800 |
| 2021 | $17,258 | $1,128,700 | $446,000 | $682,700 |
| 2020 | $16,658 | $1,109,800 | $436,000 | $673,800 |
| 2019 | $16,227 | $1,062,700 | $400,700 | $662,000 |
| 2018 | $15,651 | $1,000,700 | $386,300 | $614,400 |
| 2017 | $15,066 | $992,500 | $379,300 | $613,200 |
| 2016 | $14,773 | $996,800 | $379,300 | $617,500 |
| 2015 | $14,266 | $953,000 | $365,800 | $587,200 |
F
Seller's Agent in 2012
Frank Bolway
Stone Wall Real Estate
Source: MLS Property Information Network (MLS PIN)
MLS Number: 71339997
APN: ANDO-000076-000033
Disclaimer: Certain information contained herein is derived from information provided by parties other than Homes.com. All information provided is deemed reliable, but is not guaranteed to be accurate and should be independently verified.
![]() The property listing data and information, or the Images, set forth herein were provided to MLS Property Information Network, Inc. from third party sources, including sellers, lessors and public records, and were compiled by MLS Property Information Network, Inc. The property listing data and information, and the Images, are for the personal, non-commercial use of consumers having a good faith interest in purchasing or leasing listed properties of the type displayed to them and may not be used for any purpose other than to identify prospective properties which such consumers may have a good faith interest in purchasing or leasing. MLS Property Information Network, Inc. and its subscribers disclaim any and all representations and warranties as to the accuracy of the property listing data and information, or as to the accuracy of any of the Images, set forth herein.
The property listing data and information, or the Images, set forth herein were provided to MLS Property Information Network, Inc. from third party sources, including sellers, lessors and public records, and were compiled by MLS Property Information Network, Inc. The property listing data and information, and the Images, are for the personal, non-commercial use of consumers having a good faith interest in purchasing or leasing listed properties of the type displayed to them and may not be used for any purpose other than to identify prospective properties which such consumers may have a good faith interest in purchasing or leasing. MLS Property Information Network, Inc. and its subscribers disclaim any and all representations and warranties as to the accuracy of the property listing data and information, or as to the accuracy of any of the Images, set forth herein.