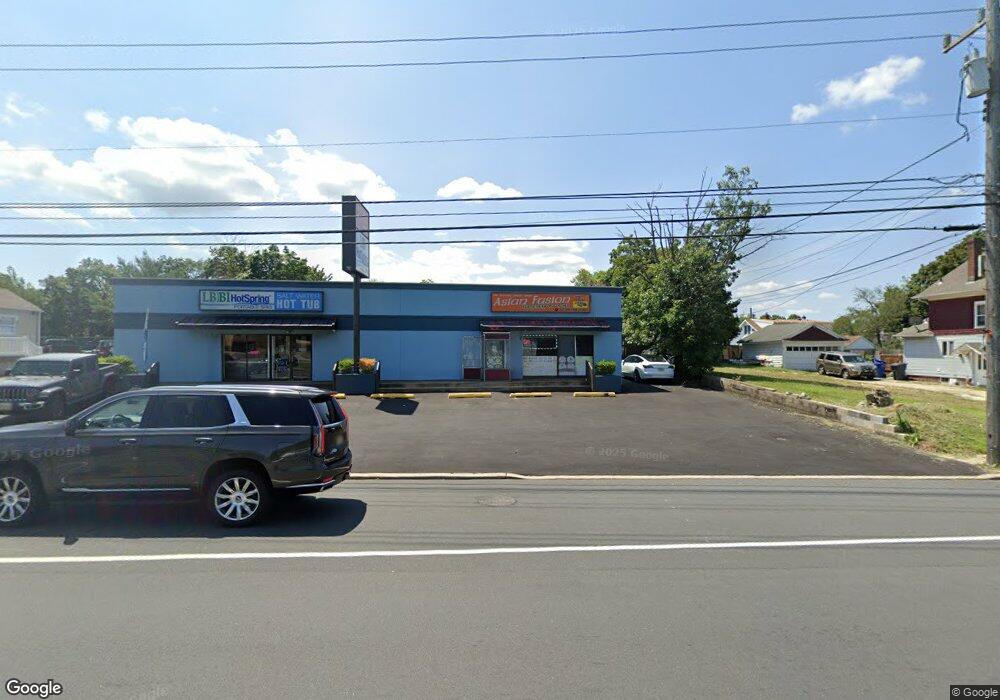
43 Route 37 E Toms River, NJ 08753
Estimated Value: $627,699
--
Bed
--
Bath
3,800
Sq Ft
$165/Sq Ft
Est. Value
About This Home
This home is located at 43 Route 37 E, Toms River, NJ 08753 and is currently estimated at $627,699, approximately $165 per square foot. 43 Route 37 E is a home located in Ocean County.
Ownership History
Date
Name
Owned For
Owner Type
Purchase Details
Closed on
May 23, 2022
Sold by
43 Route 37 East Llc
Bought by
Ajsj 4345 Llc
Current Estimated Value
Home Financials for this Owner
Home Financials are based on the most recent Mortgage that was taken out on this home.
Original Mortgage
$400,001
Outstanding Balance
$380,828
Interest Rate
5.5%
Mortgage Type
New Conventional
Estimated Equity
$246,871
Purchase Details
Closed on
Jan 27, 2009
Sold by
Levine Muriel and Metersky Morton
Bought by
43 Route 37 East Llc
Home Financials for this Owner
Home Financials are based on the most recent Mortgage that was taken out on this home.
Original Mortgage
$330,000
Interest Rate
6.5%
Mortgage Type
Commercial
Create a Home Valuation Report for This Property
The Home Valuation Report is an in-depth analysis detailing your home's value as well as a comparison with similar homes in the area
Home Values in the Area
Average Home Value in this Area
Purchase History
| Date | Buyer | Sale Price | Title Company |
|---|---|---|---|
| Ajsj 4345 Llc | $499,000 | Chicago Title | |
| 43 Route 37 East Llc | $442,500 | None Available |
Source: Public Records
Mortgage History
| Date | Status | Borrower | Loan Amount |
|---|---|---|---|
| Open | Ajsj 4345 Llc | $400,001 | |
| Previous Owner | 43 Route 37 East Llc | $330,000 |
Source: Public Records
Tax History Compared to Growth
Tax History
| Year | Tax Paid | Tax Assessment Tax Assessment Total Assessment is a certain percentage of the fair market value that is determined by local assessors to be the total taxable value of land and additions on the property. | Land | Improvement |
|---|---|---|---|---|
| 2025 | $12,777 | $684,000 | $200,000 | $484,000 |
| 2024 | $12,162 | $684,000 | $200,000 | $484,000 |
| 2023 | $11,731 | $684,000 | $200,000 | $484,000 |
| 2022 | $11,731 | $684,000 | $200,000 | $484,000 |
| 2021 | $12,810 | $500,000 | $199,500 | $300,500 |
| 2020 | $12,755 | $500,000 | $199,500 | $300,500 |
| 2019 | $11,930 | $500,000 | $199,500 | $300,500 |
| 2018 | $12,020 | $500,000 | $199,500 | $300,500 |
| 2017 | $11,915 | $500,000 | $199,500 | $300,500 |
| 2016 | $11,610 | $500,000 | $199,500 | $300,500 |
| 2015 | $12,717 | $570,000 | $199,500 | $370,500 |
| 2014 | $12,118 | $570,000 | $199,500 | $370,500 |
Source: Public Records
Map
Nearby Homes