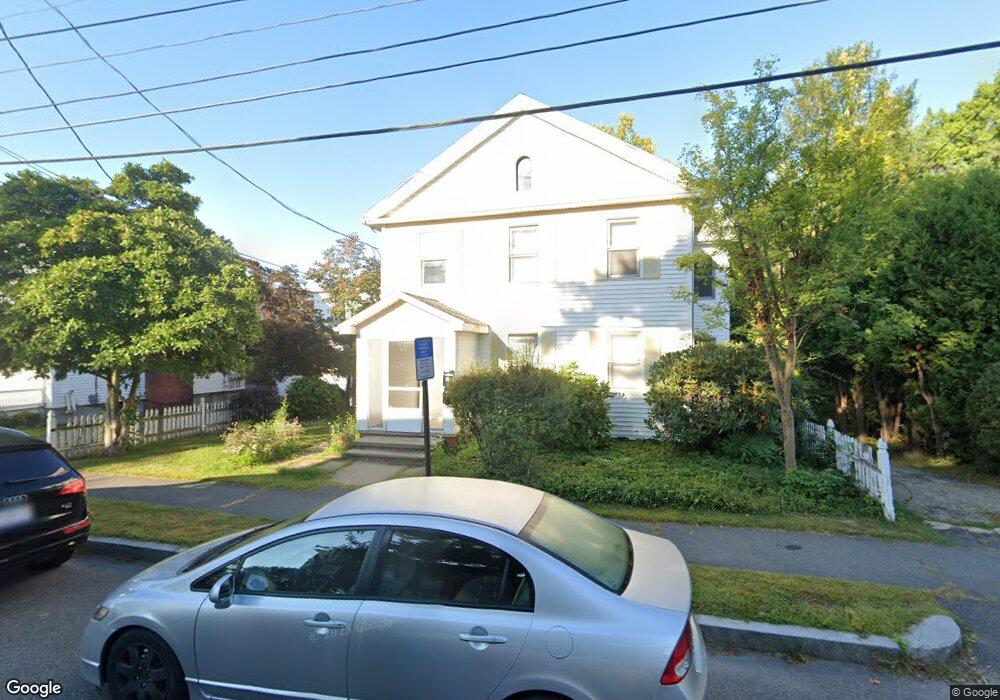
43 S Prospect St Amherst, MA 01002
Estimated Value: $625,840 - $953,000
5
Beds
3
Baths
2,072
Sq Ft
$369/Sq Ft
Est. Value
About This Home
This home is located at 43 S Prospect St, Amherst, MA 01002 and is currently estimated at $764,210, approximately $368 per square foot. 43 S Prospect St is a home located in Hampshire County with nearby schools including Crocker Farm Elementary School, Amherst Regional Middle School, and Amherst Regional High School.
Ownership History
Date
Name
Owned For
Owner Type
Purchase Details
Closed on
Aug 19, 1998
Sold by
Scott Joann C
Bought by
Eaton Robert W and Jaqual Touria
Current Estimated Value
Home Financials for this Owner
Home Financials are based on the most recent Mortgage that was taken out on this home.
Original Mortgage
$204,300
Interest Rate
6.86%
Mortgage Type
Purchase Money Mortgage
Create a Home Valuation Report for This Property
The Home Valuation Report is an in-depth analysis detailing your home's value as well as a comparison with similar homes in the area
Home Values in the Area
Average Home Value in this Area
Purchase History
| Date | Buyer | Sale Price | Title Company |
|---|---|---|---|
| Eaton Robert W | $227,000 | -- |
Source: Public Records
Mortgage History
| Date | Status | Borrower | Loan Amount |
|---|---|---|---|
| Open | Eaton Robert W | $246,500 | |
| Closed | Eaton Robert W | $204,300 | |
| Previous Owner | Eaton Robert W | $15,000 | |
| Previous Owner | Eaton Robert W | $50,000 |
Source: Public Records
Tax History
| Year | Tax Paid | Tax Assessment Tax Assessment Total Assessment is a certain percentage of the fair market value that is determined by local assessors to be the total taxable value of land and additions on the property. | Land | Improvement |
|---|---|---|---|---|
| 2025 | $97 | $539,700 | $202,300 | $337,400 |
| 2024 | $9,174 | $495,600 | $190,800 | $304,800 |
| 2023 | $8,776 | $436,600 | $173,400 | $263,200 |
| 2022 | $8,463 | $397,900 | $157,700 | $240,200 |
| 2021 | $8,429 | $386,300 | $146,100 | $240,200 |
| 2020 | $8,236 | $386,300 | $146,100 | $240,200 |
| 2019 | $7,961 | $365,200 | $146,100 | $219,100 |
| 2018 | $7,720 | $365,200 | $146,100 | $219,100 |
| 2017 | $7,461 | $341,800 | $139,100 | $202,700 |
| 2016 | $7,253 | $341,800 | $139,100 | $202,700 |
| 2015 | $7,021 | $341,800 | $139,100 | $202,700 |
Source: Public Records
Map
Nearby Homes
- 0 Main St
- 174 Lincoln Ave
- 75 Amity Place Unit 75
- 63 Amity Place Unit 63
- 48 Gray St
- 50 Mount Pleasant
- 0 Red Gate Ln Unit 73348273
- 60 Red Gate Ln
- 24 Greenleaves Dr Unit 418
- 30 Greenleaves Dr
- 26 Greenleaves Dr Unit 635
- 26 Greenleaves Dr Unit 624
- 27 Greenleaves Dr Unit 726
- 23 Greenleaves Dr Unit 107
- 242 N East St Unit 24
- 310 Belchertown Rd
- 170 E Hadley Rd Unit 87
- Lot 3 Roosevelt St
- 185 Cherry Ln
- 6 Eveningstar Dr
- 24 Gaylord St
- 55 S Prospect St
- 15 Gaylord St
- 27 S Prospect St
- 17 Gaylord St
- 28 Gaylord St
- 27 Gaylord St
- 39 Kendrick Place
- 19 S Prospect St
- 50 Kendrick Place
- 48 Kendrick Place
- 33 Gaylord St
- 40 Kendrick Place
- 11 S Prospect St
- 27 Kendrick Place
- 61 Lincoln Ave
- 32 Kendrick Place
- 75 S Prospect St
- 87 Lincoln Ave
- 67 Lincoln Ave
Your Personal Tour Guide
Ask me questions while you tour the home.