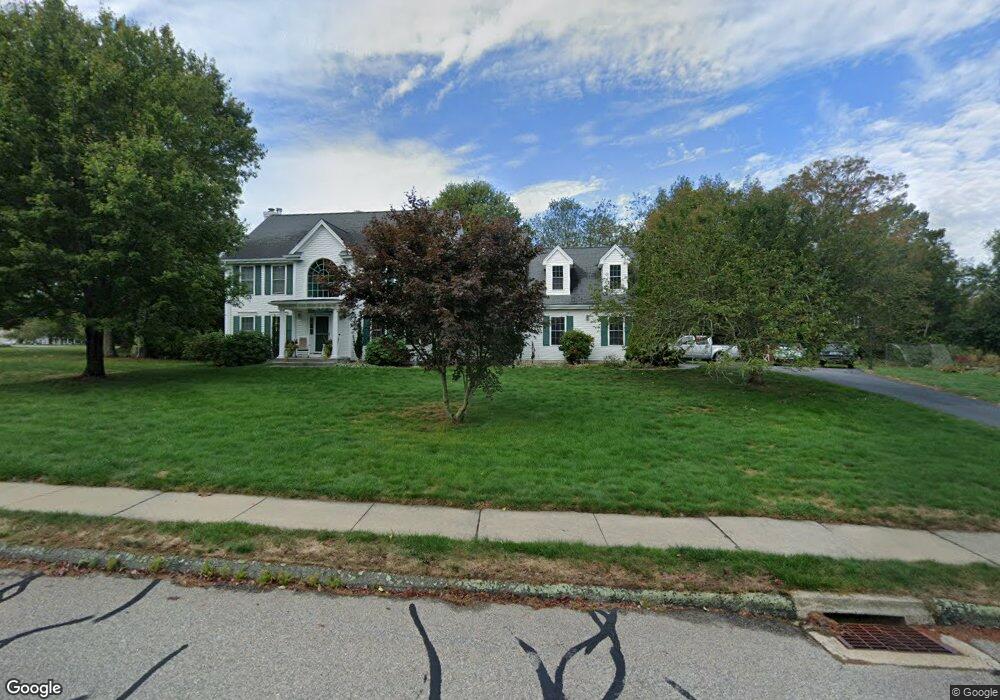
43 Sable Dr Ledyard, CT 06339
Estimated Value: $709,092 - $785,000
5
Beds
3
Baths
3,181
Sq Ft
$237/Sq Ft
Est. Value
About This Home
This home is located at 43 Sable Dr, Ledyard, CT 06339 and is currently estimated at $753,273, approximately $236 per square foot. 43 Sable Dr is a home located in New London County with nearby schools including Ledyard Middle School and Ledyard High School.
Ownership History
Date
Name
Owned For
Owner Type
Purchase Details
Closed on
Dec 21, 2010
Sold by
Garnes Keith T
Bought by
Graul Aracely C and Graul Timothy W
Current Estimated Value
Home Financials for this Owner
Home Financials are based on the most recent Mortgage that was taken out on this home.
Original Mortgage
$314,400
Outstanding Balance
$213,375
Interest Rate
4.23%
Estimated Equity
$539,898
Purchase Details
Closed on
Sep 16, 2002
Sold by
Brom Builders Inc
Bought by
Garnes Keith T and Garnes Dawn E
Home Financials for this Owner
Home Financials are based on the most recent Mortgage that was taken out on this home.
Original Mortgage
$265,000
Interest Rate
6.48%
Purchase Details
Closed on
Jan 24, 2002
Sold by
Mt Holding Llc
Bought by
Brom Bldrs Inc
Create a Home Valuation Report for This Property
The Home Valuation Report is an in-depth analysis detailing your home's value as well as a comparison with similar homes in the area
Home Values in the Area
Average Home Value in this Area
Purchase History
| Date | Buyer | Sale Price | Title Company |
|---|---|---|---|
| Graul Aracely C | $393,000 | -- | |
| Garnes Keith T | $444,000 | -- | |
| Brom Bldrs Inc | $78,500 | -- |
Source: Public Records
Mortgage History
| Date | Status | Borrower | Loan Amount |
|---|---|---|---|
| Open | Graul Aracely C | $314,400 | |
| Closed | Brom Bldrs Inc | $19,650 | |
| Previous Owner | Brom Bldrs Inc | $28,000 | |
| Previous Owner | Brom Bldrs Inc | $43,200 | |
| Previous Owner | Brom Bldrs Inc | $265,000 |
Source: Public Records
Tax History
| Year | Tax Paid | Tax Assessment Tax Assessment Total Assessment is a certain percentage of the fair market value that is determined by local assessors to be the total taxable value of land and additions on the property. | Land | Improvement |
|---|---|---|---|---|
| 2025 | $11,551 | $311,010 | $62,090 | $248,920 |
| 2024 | $10,911 | $309,890 | $62,090 | $247,800 |
| 2023 | $10,710 | $309,890 | $62,090 | $247,800 |
| 2022 | $10,480 | $309,890 | $62,090 | $247,800 |
| 2021 | $10,412 | $309,890 | $62,090 | $247,800 |
| 2020 | $10,367 | $296,450 | $67,060 | $229,390 |
| 2019 | $10,394 | $296,450 | $67,060 | $229,390 |
| 2018 | $10,165 | $296,450 | $67,060 | $229,390 |
| 2017 | $9,646 | $296,450 | $67,060 | $229,390 |
| 2016 | $9,457 | $296,450 | $67,060 | $229,390 |
| 2015 | $9,012 | $296,450 | $67,060 | $229,390 |
| 2014 | $9,239 | $308,980 | $72,100 | $236,880 |
Source: Public Records
Map
Nearby Homes
- 497 Colonel Ledyard Hwy
- 669 Colonel Ledyard Hwy
- 459 Colonel Ledyard Hwy
- 419 Colonel Ledyard Hwy
- 24 Fairway Dr Unit 9
- 3 Hilltop Dr
- 25 Marty's Way
- 18 Marty's Way
- 1661 Center Groton Rd
- 1541 North Rd
- 254 Haley Rd
- 16 Marty's Way
- 22 Boulder Way
- 186 Haley Rd
- 113 Meeting House Ln
- 59 Pheasant Run Dr
- 115 Meeting House Ln
- 20 Lakeside Dr Unit K
- 669 Shewville Rd
- 70 Partridge Hollow Rd
Your Personal Tour Guide
Ask me questions while you tour the home.