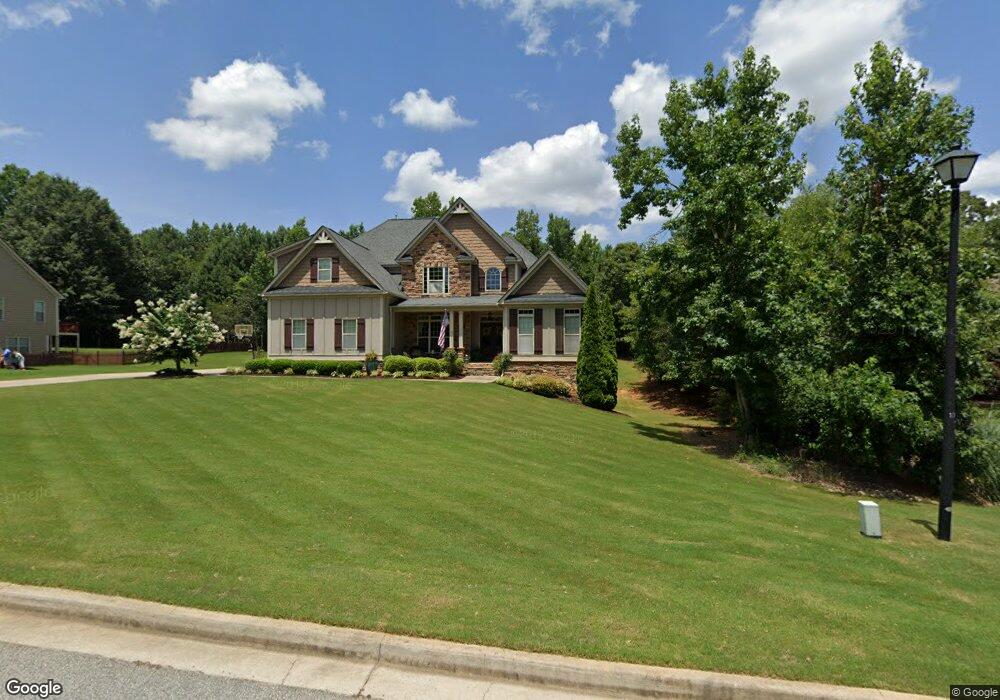
43 Saddleback Ledge Way Sharpsburg, GA 30277
Estimated Value: $723,639 - $1,015,000
5
Beds
5
Baths
3,195
Sq Ft
$274/Sq Ft
Est. Value
About This Home
This home is located at 43 Saddleback Ledge Way, Sharpsburg, GA 30277 and is currently estimated at $876,660, approximately $274 per square foot. 43 Saddleback Ledge Way is a home located in Coweta County with nearby schools including Canongate Elementary School, Madras Middle School, and Northgate High School.
Ownership History
Date
Name
Owned For
Owner Type
Purchase Details
Closed on
Jun 25, 2012
Sold by
Ross Marty J
Bought by
Ross Marty J and Ross Shannon L
Current Estimated Value
Home Financials for this Owner
Home Financials are based on the most recent Mortgage that was taken out on this home.
Original Mortgage
$349,000
Outstanding Balance
$240,553
Interest Rate
3.79%
Mortgage Type
New Conventional
Estimated Equity
$636,107
Purchase Details
Closed on
Nov 18, 2008
Sold by
Lichty Brothers Homes Inc
Bought by
Ross Marty J
Home Financials for this Owner
Home Financials are based on the most recent Mortgage that was taken out on this home.
Original Mortgage
$357,600
Interest Rate
5.89%
Mortgage Type
New Conventional
Purchase Details
Closed on
Jun 13, 2008
Sold by
Rockport Inc
Bought by
Lichty Brothers Homes Inc
Purchase Details
Closed on
Jul 27, 1993
Bought by
Rockport Inc
Purchase Details
Closed on
Mar 31, 1985
Bought by
Trust Company Bank(T
Create a Home Valuation Report for This Property
The Home Valuation Report is an in-depth analysis detailing your home's value as well as a comparison with similar homes in the area
Home Values in the Area
Average Home Value in this Area
Purchase History
| Date | Buyer | Sale Price | Title Company |
|---|---|---|---|
| Ross Marty J | -- | -- | |
| Ross Marty J | $447,000 | -- | |
| Lichty Brothers Homes Inc | $110,000 | -- | |
| Rockport Inc | $843,600 | -- | |
| Trust Company Bank(T | -- | -- |
Source: Public Records
Mortgage History
| Date | Status | Borrower | Loan Amount |
|---|---|---|---|
| Open | Ross Marty J | $349,000 | |
| Previous Owner | Ross Marty J | $357,600 |
Source: Public Records
Tax History Compared to Growth
Tax History
| Year | Tax Paid | Tax Assessment Tax Assessment Total Assessment is a certain percentage of the fair market value that is determined by local assessors to be the total taxable value of land and additions on the property. | Land | Improvement |
|---|---|---|---|---|
| 2025 | $6,746 | $294,288 | $42,000 | $252,288 |
| 2024 | $6,471 | $283,354 | $42,000 | $241,354 |
| 2023 | $6,471 | $267,111 | $30,000 | $237,111 |
| 2022 | $5,574 | $230,988 | $28,000 | $202,988 |
| 2021 | $5,250 | $204,096 | $28,000 | $176,096 |
| 2020 | $5,284 | $204,096 | $28,000 | $176,096 |
| 2019 | $5,465 | $191,507 | $22,000 | $169,507 |
| 2018 | $5,475 | $191,507 | $22,000 | $169,507 |
| 2017 | $5,237 | $183,436 | $22,000 | $161,436 |
| 2016 | $5,176 | $183,436 | $22,000 | $161,436 |
| 2015 | $4,697 | $169,598 | $22,000 | $147,598 |
| 2014 | $4,499 | $163,832 | $22,000 | $141,832 |
Source: Public Records
Map
Nearby Homes
- 12 Race Point Way
- 319 Beaconsfield Dr
- 125 Cannongate Cir
- 95 Tyler Woods Dr
- 25 Sycamore Way
- 131 Cannongate Cir
- 259 Strathmore Dr Unit 3
- 121 Northwoods Rd
- 75 Tomahawk Dr
- 10 Monteray Ct
- 2043 Fischer Rd
- 2039 Fischer Rd
- 10 Fisher Way
- 40 Wenham Ln
- 70 N Strathmore Dr
- 68 Timbercreek Estates
- 68 Timbercreek Estates Dr
- 20 Skipton Ct
- 972 Raymond Hill Rd
- 0 Maple Trail
- 31 Saddleback Ledge Way
- 57 Saddleback Ledge Way
- 0 Long Point Ln Unit 7077139
- 98 Saddleback Ledge Way Unit 98
- 0 Saddleback Ledge Way
- 219 Sandisfield Dr
- 71 Saddleback Ledge Way
- 191 Sandisfield Dr
- 9 Long Point Ln
- 22 Saddleback Ledge Way
- 8 Long Point Ln
- 0 Sandisfield Dr Unit 8624615
- 0 Sandisfield Dr Unit 8544819
- 0 Sandisfield Dr Unit 8105840
- 0 Sandisfield Dr Unit 8010575
- 0 Sandisfield Dr Unit 9063483
- 0 Sandisfield Dr Unit 8888303
- 0 Sandisfield Dr Unit 3197156
- 0 Sandisfield Dr Unit 7013228
- 0 Sandisfield Dr Unit 7326566