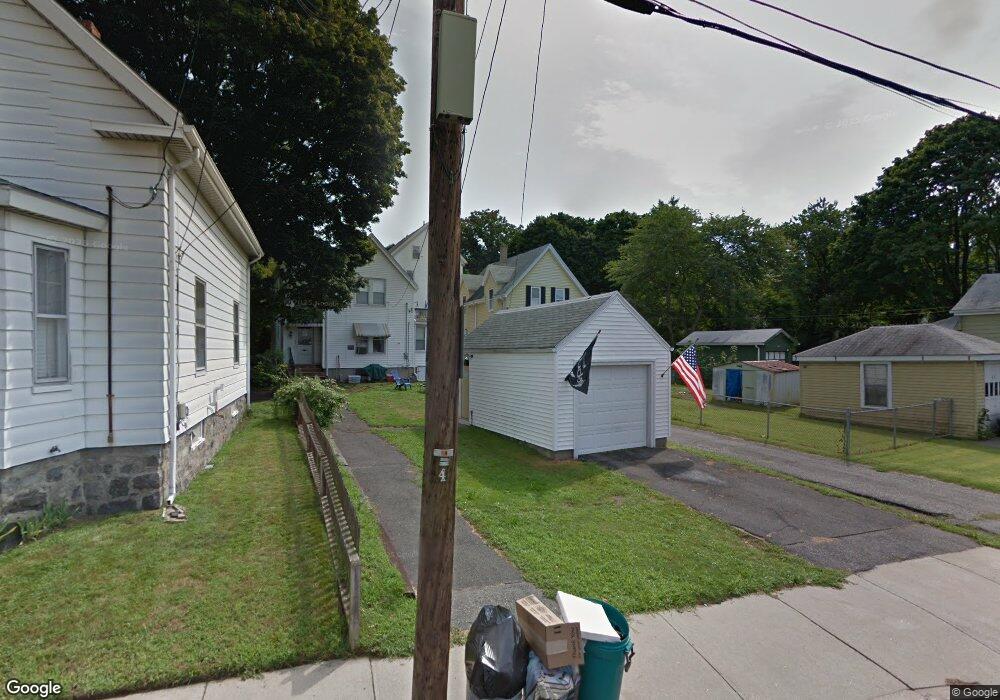
43 Safford St Lynn, MA 01905
Austin Square NeighborhoodEstimated Value: $376,000 - $544,000
3
Beds
2
Baths
1,086
Sq Ft
$446/Sq Ft
Est. Value
About This Home
This home is located at 43 Safford St, Lynn, MA 01905 and is currently estimated at $483,906, approximately $445 per square foot. 43 Safford St is a home located in Essex County with nearby schools including Julia F. Callahan Elementary School, William R. Fallon School, and Breed Middle School.
Ownership History
Date
Name
Owned For
Owner Type
Purchase Details
Closed on
Aug 7, 2023
Sold by
Amirault Matthew J
Bought by
Amirault Katina and Amirault Matthew J
Current Estimated Value
Home Financials for this Owner
Home Financials are based on the most recent Mortgage that was taken out on this home.
Original Mortgage
$65,000
Outstanding Balance
$62,595
Interest Rate
6.81%
Mortgage Type
Credit Line Revolving
Estimated Equity
$421,311
Purchase Details
Closed on
Sep 30, 2008
Sold by
Stanford Louise C
Bought by
Amirault Matthew J
Home Financials for this Owner
Home Financials are based on the most recent Mortgage that was taken out on this home.
Original Mortgage
$152,229
Interest Rate
6.57%
Mortgage Type
Purchase Money Mortgage
Create a Home Valuation Report for This Property
The Home Valuation Report is an in-depth analysis detailing your home's value as well as a comparison with similar homes in the area
Home Values in the Area
Average Home Value in this Area
Purchase History
| Date | Buyer | Sale Price | Title Company |
|---|---|---|---|
| Amirault Katina | -- | None Available | |
| Amirault Katina | -- | None Available | |
| Amirault Katina | -- | None Available | |
| Amirault Katina | -- | None Available | |
| Amirault Matthew J | $155,000 | -- | |
| Amirault Matthew J | $155,000 | -- |
Source: Public Records
Mortgage History
| Date | Status | Borrower | Loan Amount |
|---|---|---|---|
| Open | Amirault Katina | $65,000 | |
| Closed | Amirault Katina | $65,000 | |
| Previous Owner | Amirault Matthew J | $154,318 | |
| Previous Owner | Amirault Matthew J | $152,229 |
Source: Public Records
Tax History Compared to Growth
Tax History
| Year | Tax Paid | Tax Assessment Tax Assessment Total Assessment is a certain percentage of the fair market value that is determined by local assessors to be the total taxable value of land and additions on the property. | Land | Improvement |
|---|---|---|---|---|
| 2025 | $4,455 | $430,000 | $197,200 | $232,800 |
| 2024 | $4,251 | $403,700 | $183,400 | $220,300 |
| 2023 | $4,422 | $396,600 | $202,800 | $193,800 |
| 2022 | $4,094 | $329,400 | $155,300 | $174,100 |
| 2021 | $3,871 | $297,100 | $134,200 | $162,900 |
| 2020 | $3,863 | $288,300 | $137,600 | $150,700 |
| 2019 | $3,794 | $265,300 | $123,000 | $142,300 |
| 2018 | $3,503 | $231,200 | $110,900 | $120,300 |
| 2017 | $3,262 | $209,100 | $97,100 | $112,000 |
| 2016 | $3,162 | $195,400 | $89,300 | $106,100 |
| 2015 | $3,104 | $185,300 | $91,900 | $93,400 |
Source: Public Records
Map
Nearby Homes
- 100 Ashland St
- 79 Laurel St
- 86 Laurel St
- 35 Curran Rd
- 725 Boston St
- 28 Margin St Unit A
- 110 Holyoke St
- 28 Wyman St
- 45 Cottage St Unit 3
- 16 River St Unit 6
- 20 Murray St
- 19 Hood St
- 268 Walnut St
- 32 Birch Brook Rd Unit 13
- 32 Birch Brook Rd Unit 27
- 32 Birch Brook Rd Unit 16
- 32 Birch Brook Rd Unit 1
- 32 Birch Brook Rd Unit 15
- 32 Birch Brook Rd Unit 25
- 32 Birch Brook Rd Unit 22