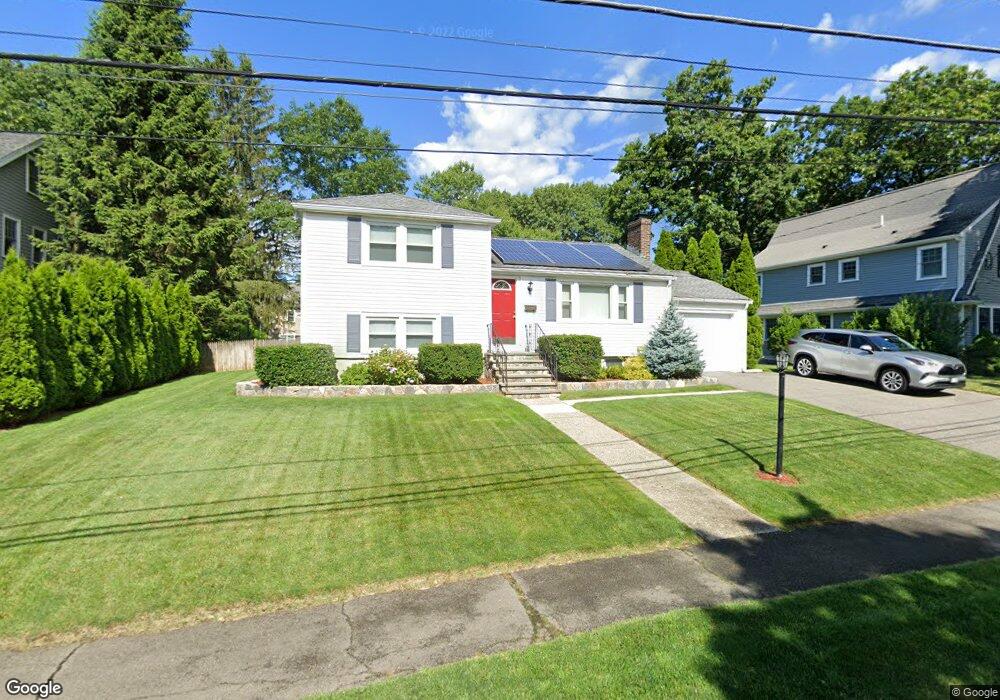
43 Savoy Rd Needham, MA 02492
Estimated Value: $1,224,000 - $1,425,000
2
Beds
3
Baths
1,186
Sq Ft
$1,088/Sq Ft
Est. Value
About This Home
This home is located at 43 Savoy Rd, Needham, MA 02492 and is currently estimated at $1,290,319, approximately $1,087 per square foot. 43 Savoy Rd is a home located in Norfolk County with nearby schools including Mitchell Elementary School, High Rock Middle School, and Pollard Middle School.
Ownership History
Date
Name
Owned For
Owner Type
Purchase Details
Closed on
Jun 18, 1998
Sold by
Luttazi Ramon E
Bought by
Murphy Susan A and Murphy Wayne M
Current Estimated Value
Home Financials for this Owner
Home Financials are based on the most recent Mortgage that was taken out on this home.
Original Mortgage
$170,000
Outstanding Balance
$34,128
Interest Rate
7.09%
Mortgage Type
Purchase Money Mortgage
Estimated Equity
$1,256,191
Create a Home Valuation Report for This Property
The Home Valuation Report is an in-depth analysis detailing your home's value as well as a comparison with similar homes in the area
Home Values in the Area
Average Home Value in this Area
Purchase History
| Date | Buyer | Sale Price | Title Company |
|---|---|---|---|
| Murphy Susan A | $240,000 | -- | |
| Murphy Susan A | $240,000 | -- |
Source: Public Records
Mortgage History
| Date | Status | Borrower | Loan Amount |
|---|---|---|---|
| Open | Murphy Susan A | $170,000 | |
| Closed | Murphy Susan A | $170,000 | |
| Previous Owner | Murphy Susan A | $50,000 | |
| Previous Owner | Murphy Susan A | $140,000 |
Source: Public Records
Tax History Compared to Growth
Tax History
| Year | Tax Paid | Tax Assessment Tax Assessment Total Assessment is a certain percentage of the fair market value that is determined by local assessors to be the total taxable value of land and additions on the property. | Land | Improvement |
|---|---|---|---|---|
| 2025 | $10,880 | $1,026,400 | $800,700 | $225,700 |
| 2024 | $10,117 | $808,100 | $589,400 | $218,700 |
| 2023 | $10,319 | $791,300 | $589,400 | $201,900 |
| 2022 | $9,561 | $715,100 | $521,600 | $193,500 |
| 2021 | $9,318 | $715,100 | $521,600 | $193,500 |
| 2020 | $9,183 | $735,200 | $521,500 | $213,700 |
| 2019 | $8,500 | $686,000 | $474,100 | $211,900 |
| 2018 | $8,150 | $686,000 | $474,100 | $211,900 |
| 2017 | $7,838 | $659,200 | $474,100 | $185,100 |
| 2016 | $7,637 | $661,800 | $474,100 | $187,700 |
| 2015 | $7,472 | $661,800 | $474,100 | $187,700 |
| 2014 | $6,709 | $576,400 | $395,100 | $181,300 |
Source: Public Records
Map
Nearby Homes
- 332 Hillcrest Rd
- 190 Brookline St
- 701 Greendale Ave
- 62 Washington Ave
- 23 Cheney St
- 26 Pinewood Rd
- 247 Broad Meadow Rd
- 40 Otis St Unit L
- 42 Otis St Unit R
- 556 Webster St
- 883 Greendale Ave
- 9 Jayne Rd
- 143 Hunting Rd
- 154 Warren St
- 39 Mark Lee Rd
- 36 Davenport Rd
- 1052 Greendale Ave
- 210 Nahanton St Unit 404
- 107 Valley Rd
- 445 Hillside Ave