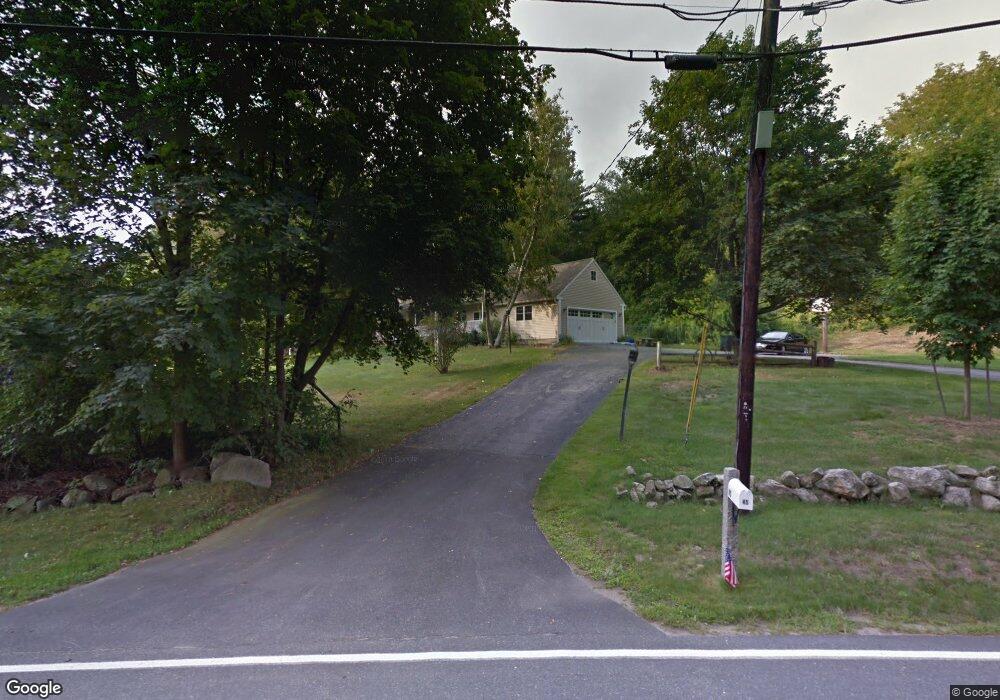
43 Smith Rd Bedford, NH 03110
Bedford NeighborhoodEstimated Value: $1,053,757 - $1,190,000
4
Beds
3
Baths
4,267
Sq Ft
$263/Sq Ft
Est. Value
About This Home
This home is located at 43 Smith Rd, Bedford, NH 03110 and is currently estimated at $1,122,939, approximately $263 per square foot. 43 Smith Rd is a home located in Hillsborough County with nearby schools including Mckelvie Intermediate School, Ross A. Lurgio Middle School, and Bedford High School.
Ownership History
Date
Name
Owned For
Owner Type
Purchase Details
Closed on
May 24, 1999
Sold by
Berg Ruth N
Bought by
Hauser Kenneth E and Hauser Glenn K
Current Estimated Value
Home Financials for this Owner
Home Financials are based on the most recent Mortgage that was taken out on this home.
Original Mortgage
$240,000
Interest Rate
6.88%
Create a Home Valuation Report for This Property
The Home Valuation Report is an in-depth analysis detailing your home's value as well as a comparison with similar homes in the area
Home Values in the Area
Average Home Value in this Area
Purchase History
| Date | Buyer | Sale Price | Title Company |
|---|---|---|---|
| Hauser Kenneth E | $265,000 | -- |
Source: Public Records
Mortgage History
| Date | Status | Borrower | Loan Amount |
|---|---|---|---|
| Open | Hauser Kenneth E | $296,150 | |
| Closed | Hauser Kenneth E | $323,610 | |
| Closed | Hauser Kenneth E | $240,000 |
Source: Public Records
Tax History Compared to Growth
Tax History
| Year | Tax Paid | Tax Assessment Tax Assessment Total Assessment is a certain percentage of the fair market value that is determined by local assessors to be the total taxable value of land and additions on the property. | Land | Improvement |
|---|---|---|---|---|
| 2024 | $14,427 | $912,500 | $248,900 | $663,600 |
| 2023 | $13,505 | $912,500 | $248,900 | $663,600 |
| 2022 | $12,410 | $705,100 | $184,400 | $520,700 |
| 2021 | $12,085 | $705,100 | $184,400 | $520,700 |
| 2020 | $11,816 | $590,200 | $134,700 | $455,500 |
| 2019 | $11,184 | $590,200 | $134,700 | $455,500 |
| 2018 | $11,130 | $545,600 | $134,700 | $410,900 |
| 2017 | $10,317 | $545,600 | $134,700 | $410,900 |
| 2016 | $10,411 | $465,400 | $107,500 | $357,900 |
| 2015 | $10,593 | $465,400 | $107,500 | $357,900 |
| 2014 | $10,472 | $465,400 | $107,500 | $357,900 |
| 2013 | $10,318 | $465,400 | $107,500 | $357,900 |
Source: Public Records
Map
Nearby Homes
- 18 Horizon Dr
- 10 Barrington Dr
- 197 Liberty Hill Rd
- 56 Greenfield Pkwy
- 16 Summit Rd
- 40 Seton Dr
- 5 Barbie Ct
- 116 Nashua Rd
- 155 Wallace Rd
- 150 Wallace Rd
- 7 Hamilton Way
- 29 Bedford Rd
- 22 Kimberly Dr
- 769 Daniel Webster Hwy
- 34 Chatham Dr
- 29 Pebble Beach Dr
- 15 Spyglass Point Cir
- 20 Pebble Beach Dr Unit 22-89-20
- 4243 Brown Ave
- 4481 Brown Ave