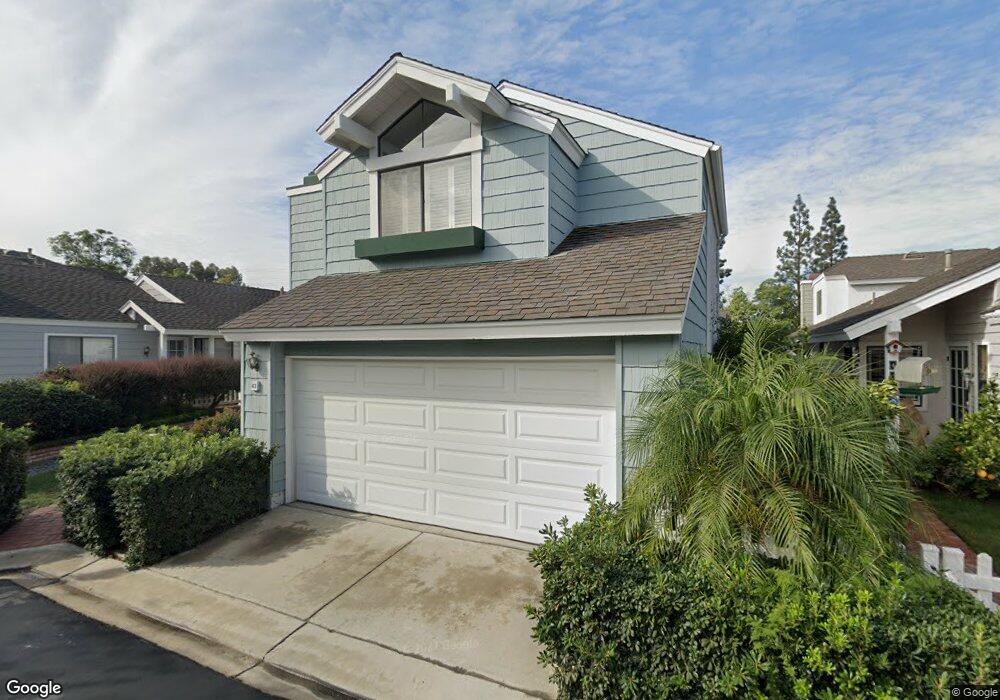
43 Summerfield Irvine, CA 92614
Woodbridge NeighborhoodEstimated Value: $1,056,000 - $1,212,000
3
Beds
3
Baths
1,435
Sq Ft
$815/Sq Ft
Est. Value
About This Home
This home is located at 43 Summerfield, Irvine, CA 92614 and is currently estimated at $1,169,373, approximately $814 per square foot. 43 Summerfield is a home located in Orange County with nearby schools including Springbrook Elementary School, South Lake Middle School, and Woodbridge High School.
Ownership History
Date
Name
Owned For
Owner Type
Purchase Details
Closed on
Nov 21, 2008
Sold by
Malone Denise
Bought by
Malone Denise C and The Denise C Malone Trust
Current Estimated Value
Purchase Details
Closed on
Dec 27, 2002
Sold by
Malone Denise
Bought by
Malone Denise
Home Financials for this Owner
Home Financials are based on the most recent Mortgage that was taken out on this home.
Original Mortgage
$219,800
Interest Rate
5.96%
Purchase Details
Closed on
Jul 8, 1998
Sold by
Lazenby Caroline M V
Bought by
Malone Denise and Williams Curt
Home Financials for this Owner
Home Financials are based on the most recent Mortgage that was taken out on this home.
Original Mortgage
$227,150
Interest Rate
6.91%
Purchase Details
Closed on
Aug 2, 1994
Sold by
Yoshihara Stanley L and Yoshihara Susan G
Bought by
Lazenby Caroline M
Home Financials for this Owner
Home Financials are based on the most recent Mortgage that was taken out on this home.
Original Mortgage
$68,000
Interest Rate
8.8%
Create a Home Valuation Report for This Property
The Home Valuation Report is an in-depth analysis detailing your home's value as well as a comparison with similar homes in the area
Home Values in the Area
Average Home Value in this Area
Purchase History
| Date | Buyer | Sale Price | Title Company |
|---|---|---|---|
| Malone Denise C | -- | None Available | |
| Malone Denise | -- | -- | |
| Malone Denise | $257,000 | Guardian Title Company | |
| Lazenby Caroline M | $225,000 | Orange Coast Title |
Source: Public Records
Mortgage History
| Date | Status | Borrower | Loan Amount |
|---|---|---|---|
| Closed | Malone Denise | $219,800 | |
| Previous Owner | Malone Denise | $227,150 | |
| Previous Owner | Lazenby Caroline M | $68,000 |
Source: Public Records
Tax History
| Year | Tax Paid | Tax Assessment Tax Assessment Total Assessment is a certain percentage of the fair market value that is determined by local assessors to be the total taxable value of land and additions on the property. | Land | Improvement |
|---|---|---|---|---|
| 2025 | $4,197 | $402,890 | $237,959 | $164,931 |
| 2024 | $4,197 | $394,991 | $233,293 | $161,698 |
| 2023 | $4,088 | $387,247 | $228,719 | $158,528 |
| 2022 | $4,013 | $379,654 | $224,234 | $155,420 |
| 2021 | $3,922 | $372,210 | $219,837 | $152,373 |
| 2020 | $3,898 | $368,394 | $217,583 | $150,811 |
| 2019 | $3,811 | $361,171 | $213,317 | $147,854 |
| 2018 | $3,740 | $354,090 | $209,135 | $144,955 |
| 2017 | $3,662 | $347,148 | $205,035 | $142,113 |
| 2016 | $3,499 | $340,342 | $201,015 | $139,327 |
| 2015 | $3,446 | $335,230 | $197,995 | $137,235 |
| 2014 | $3,378 | $328,664 | $194,117 | $134,547 |
Source: Public Records
Map
Nearby Homes
- 45 Wintermist Unit 36
- 20 Wintermist
- 1 Summerfield Unit 59
- 226 Greenmoor Unit 95
- 39 Foxboro
- 4 Dogwood N
- 39 Dogwood S
- 32 Spinnaker Unit 71
- 17322 Rosewood
- 6 Banyan Tree
- 52 Weepingwood
- 123 Willowbend
- 9 Singingwood Unit 35
- 7 Onyx Unit 11
- 7 Whispering Wind
- 123 Fallingstar Unit 1
- 17682 Cassia Tree Ln
- 11 Fallingstar
- 9 Teakwood
- 527 Springbrook N
- 43 Summerfield Unit 92
- 45 Summerfield Unit 91
- 53 Summerfield
- 22 Wintermist Unit 93
- 51 Summerfield Unit 98
- 47 Summerfield Unit 90
- 47 Summerfield
- 41 Summerfield Unit 87
- 55 Summerfield Unit 96
- 24 Wintermist
- 39 Summerfield Unit 88
- 49 Summerfield Unit 99
- 20 Wintermist Unit 86
- 59 Summerfield Unit 95
- 37 Summerfield
- 18 Wintermist Unit 85
- 33 Summerfield Unit 81
- 33 Summerfield
- 35 Summerfield Unit 80
- 35 Summerfield
Your Personal Tour Guide
Ask me questions while you tour the home.