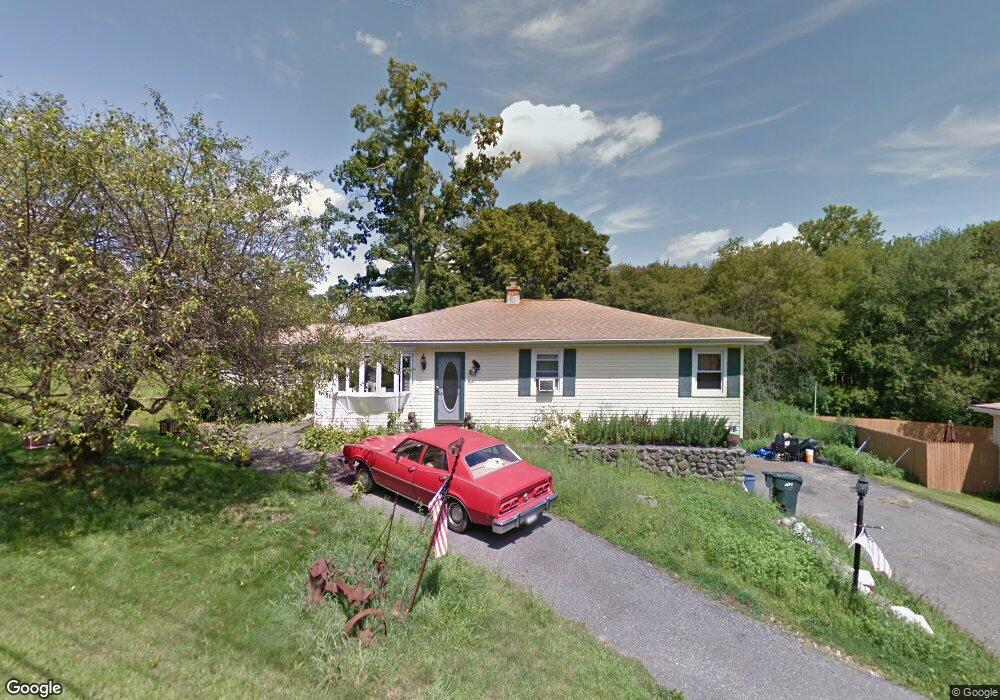
43 Summit Rd Prospect, CT 06712
Estimated Value: $338,000 - $369,000
3
Beds
1
Bath
1,372
Sq Ft
$262/Sq Ft
Est. Value
About This Home
This home is located at 43 Summit Rd, Prospect, CT 06712 and is currently estimated at $359,225, approximately $261 per square foot. 43 Summit Rd is a home located in New Haven County with nearby schools including Prospect Elementary School, Long River Middle School, and Woodland Regional High School.
Ownership History
Date
Name
Owned For
Owner Type
Purchase Details
Closed on
Mar 29, 2011
Sold by
Ferland Linda
Bought by
Ferland Leonel
Current Estimated Value
Purchase Details
Closed on
Feb 25, 2002
Sold by
Anderson Home Planner
Bought by
Ferland Leonel G and Ferland Linda L
Purchase Details
Closed on
Dec 28, 2000
Sold by
Iava Nelson J
Bought by
Anderson Ralph and Anderson Joanne
Create a Home Valuation Report for This Property
The Home Valuation Report is an in-depth analysis detailing your home's value as well as a comparison with similar homes in the area
Home Values in the Area
Average Home Value in this Area
Purchase History
| Date | Buyer | Sale Price | Title Company |
|---|---|---|---|
| Ferland Leonel | -- | -- | |
| Ferland Leonel G | $165,000 | -- | |
| Anderson Ralph | $115,000 | -- |
Source: Public Records
Mortgage History
| Date | Status | Borrower | Loan Amount |
|---|---|---|---|
| Open | Anderson Ralph | $46,542 | |
| Open | Anderson Ralph | $230,887 |
Source: Public Records
Tax History
| Year | Tax Paid | Tax Assessment Tax Assessment Total Assessment is a certain percentage of the fair market value that is determined by local assessors to be the total taxable value of land and additions on the property. | Land | Improvement |
|---|---|---|---|---|
| 2025 | $4,899 | $191,590 | $64,120 | $127,470 |
| 2024 | $4,363 | $135,760 | $64,090 | $71,670 |
| 2023 | $4,333 | $135,760 | $64,090 | $71,670 |
| 2022 | $4,338 | $135,760 | $64,090 | $71,670 |
| 2021 | $4,385 | $135,760 | $64,090 | $71,670 |
| 2020 | $4,103 | $129,850 | $64,090 | $65,760 |
| 2019 | $4,019 | $129,850 | $64,090 | $65,760 |
| 2018 | $4,025 | $129,850 | $64,090 | $65,760 |
| 2017 | $4,058 | $129,850 | $64,090 | $65,760 |
| 2016 | $3,884 | $129,850 | $64,090 | $65,760 |
| 2015 | $3,882 | $132,800 | $64,100 | $68,700 |
| 2014 | $3,849 | $132,800 | $64,100 | $68,700 |
Source: Public Records
Map
Nearby Homes
- 6 Holley Ln
- 9 Melissa Ln
- 4 Alison Ct
- 17 White Oak Dr Unit 17
- 20 Hydelor Ave
- 66 Union City Rd
- 11 Poplar Dr Unit 11
- 44 Cheshire Rd
- 156 Mikayla Ln
- 9 Cheryl Ln
- 152 Summit Rd
- 24 Rozum Cir
- 104 Cherry Cir Unit 104
- 6 Saunders Ln
- 45 Westbrook Dr
- 519 Scott Rd Unit 58
- 425 Scott Rd
- 92 Glenstone Rd
- 43 Bateswood Rd
- 26 Spruce Dr
Your Personal Tour Guide
Ask me questions while you tour the home.