Estimated Value: $736,000 - $1,118,000
4
Beds
3
Baths
3,167
Sq Ft
$303/Sq Ft
Est. Value
About This Home
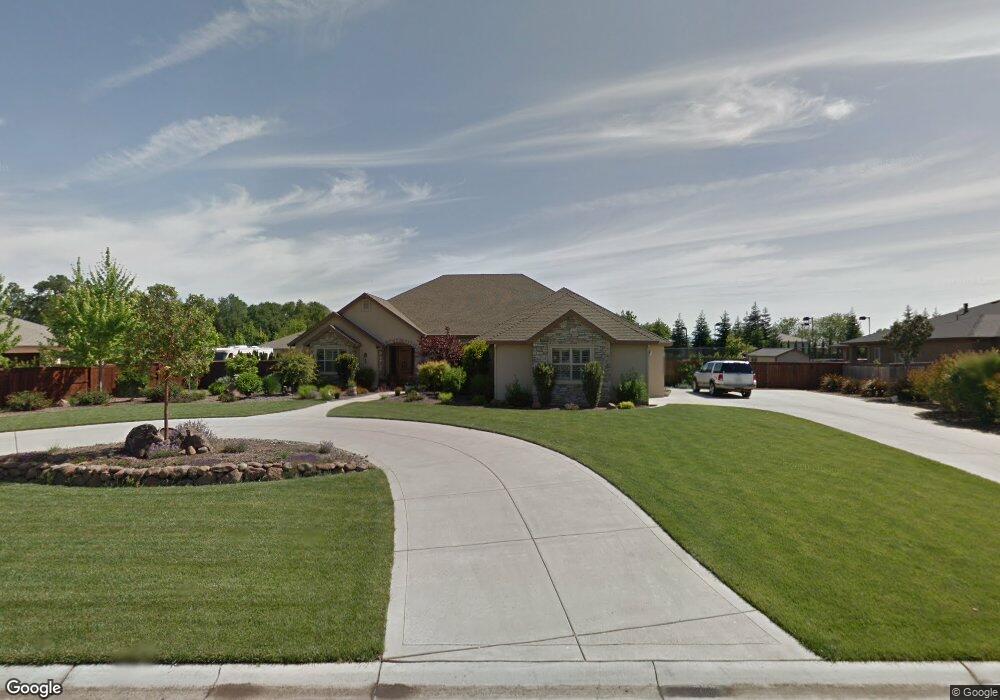
This home is located at 43 Taige Way Unit 3, Chico, CA 95928 and is currently estimated at $958,968, approximately $302 per square foot. 43 Taige Way Unit 3 is a home located in Butte County with nearby schools including Chapman Elementary School, Chico Junior High School, and Chico High School.
Ownership History
Date
Name
Owned For
Owner Type
Purchase Details
Closed on
Feb 19, 2019
Sold by
Garcia Keith E and Garcia Cinda S
Bought by
Garcia Keith Eric and Garcia Cinda Suzanne
Current Estimated Value
Purchase Details
Closed on
Feb 17, 2015
Sold by
Murphy Jonathan Earl and Murphy Jena Louise
Bought by
Garcia Keith E and Garcia Cinda S
Home Financials for this Owner
Home Financials are based on the most recent Mortgage that was taken out on this home.
Original Mortgage
$479,250
Outstanding Balance
$364,889
Interest Rate
3.6%
Mortgage Type
New Conventional
Estimated Equity
$594,079
Purchase Details
Closed on
Jan 30, 2007
Sold by
Weibel Barbara
Bought by
Murphy Jonathan Earl and Murphy Jena Louise
Home Financials for this Owner
Home Financials are based on the most recent Mortgage that was taken out on this home.
Original Mortgage
$350,000
Interest Rate
6.11%
Mortgage Type
New Conventional
Purchase Details
Closed on
Nov 21, 2005
Sold by
Parsely Development Inc
Bought by
Weibel Barbara
Create a Home Valuation Report for This Property
The Home Valuation Report is an in-depth analysis detailing your home's value as well as a comparison with similar homes in the area
Home Values in the Area
Average Home Value in this Area
Purchase History
| Date | Buyer | Sale Price | Title Company |
|---|---|---|---|
| Garcia Keith Eric | -- | None Available | |
| Garcia Keith E | $639,000 | Mid Valley Title | |
| Murphy Jonathan Earl | $712,500 | Mid Valley Title & Escrow Co | |
| Weibel Barbara | $850,000 | Mid Valley Title & Escrow Co |
Source: Public Records
Mortgage History
| Date | Status | Borrower | Loan Amount |
|---|---|---|---|
| Open | Garcia Keith E | $479,250 | |
| Previous Owner | Murphy Jonathan Earl | $350,000 |
Source: Public Records
Tax History Compared to Growth
Tax History
| Year | Tax Paid | Tax Assessment Tax Assessment Total Assessment is a certain percentage of the fair market value that is determined by local assessors to be the total taxable value of land and additions on the property. | Land | Improvement |
|---|---|---|---|---|
| 2025 | $8,718 | $809,272 | $295,947 | $513,325 |
| 2024 | $8,718 | $793,405 | $290,145 | $503,260 |
| 2023 | $8,613 | $777,849 | $284,456 | $493,393 |
| 2022 | $8,476 | $762,598 | $278,879 | $483,719 |
| 2021 | $8,311 | $747,646 | $273,411 | $474,235 |
| 2020 | $8,110 | $724,145 | $270,608 | $453,537 |
| 2019 | $7,964 | $709,947 | $265,302 | $444,645 |
| 2018 | $7,809 | $696,027 | $260,100 | $435,927 |
| 2017 | $7,654 | $682,380 | $255,000 | $427,380 |
| 2016 | $6,987 | $669,000 | $250,000 | $419,000 |
| 2015 | $7,155 | $668,000 | $250,000 | $418,000 |
| 2014 | $6,927 | $655,000 | $250,000 | $405,000 |
Source: Public Records
Map
Nearby Homes
- 0 Speedway Ave
- 0 Entler Ave
- 1 Gold Creek Way
- 0 5 9 Ac Corner of Yosemite & Humboldt Rd Unit SN25118517
- 0 Rim Rock Dr Unit PA25101414
- 0 Rim Rock Dr Unit SN24199604
- 123 Raley Blvd
- 2375 Notre Dame Blvd Unit 1
- 2375 Notre Dame Blvd Unit 8
- 12 Wrangler Ct
- 4 Freda Ct
- 2294 Mulberry St
- 18 Jasper Dr
- 2213 Laurel St
- 117 W 21st St
- 10680 Player Ln
- 770 E 20th St
- 0 Fair St Unit SN25230897
- 999 E 16th St
- 2234 Hutchinson St