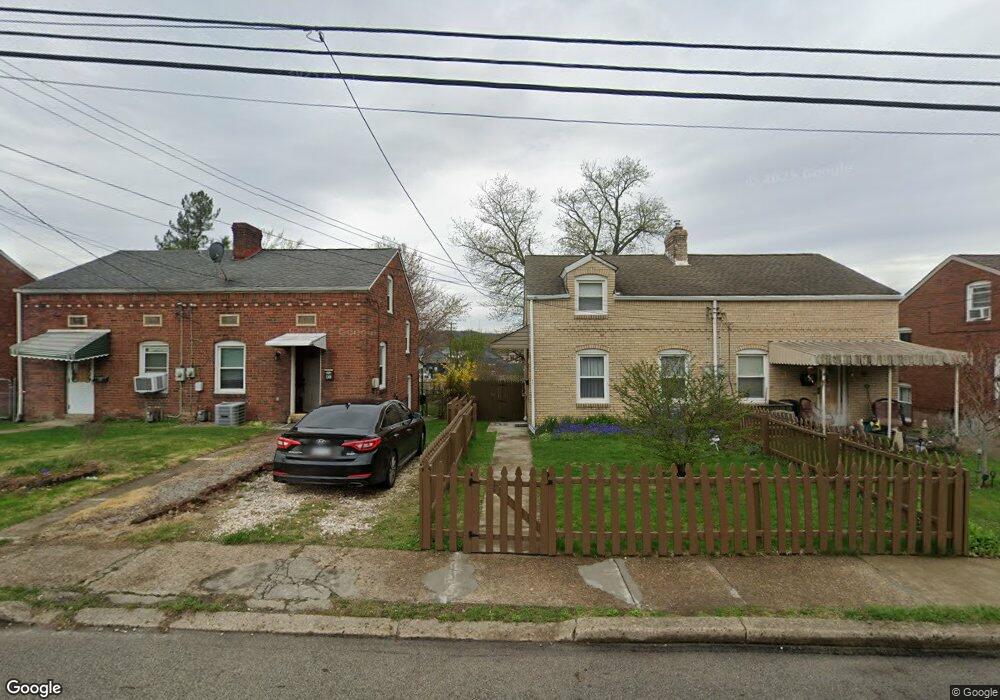
43 Thomas St Pittsburgh, PA 15205
Estimated Value: $127,000 - $145,000
2
Beds
1
Bath
751
Sq Ft
$180/Sq Ft
Est. Value
About This Home
This home is located at 43 Thomas St, Pittsburgh, PA 15205 and is currently estimated at $135,442, approximately $180 per square foot. 43 Thomas St is a home located in Allegheny County with nearby schools including Carlynton Junior/Senior High School, St. Philip School, and Al-Andalus School.
Ownership History
Date
Name
Owned For
Owner Type
Purchase Details
Closed on
Jul 20, 2009
Sold by
United States Of America
Bought by
Gibson Janet D
Current Estimated Value
Home Financials for this Owner
Home Financials are based on the most recent Mortgage that was taken out on this home.
Original Mortgage
$35,968
Outstanding Balance
$23,665
Interest Rate
5.47%
Mortgage Type
FHA
Estimated Equity
$111,777
Purchase Details
Closed on
Jan 5, 2009
Sold by
Willoughby Sallie
Bought by
Midfirst Bank
Purchase Details
Closed on
Jun 12, 1995
Sold by
Willoughby Sallie E
Bought by
Willoughby Sallie E and Warner Edward V
Purchase Details
Closed on
Mar 30, 1995
Sold by
Fromholzer Linda Ann and Nagy Linda
Bought by
Willoughby Sallie E
Create a Home Valuation Report for This Property
The Home Valuation Report is an in-depth analysis detailing your home's value as well as a comparison with similar homes in the area
Home Values in the Area
Average Home Value in this Area
Purchase History
| Date | Buyer | Sale Price | Title Company |
|---|---|---|---|
| Gibson Janet D | $27,850 | -- | |
| Midfirst Bank | $1,784 | -- | |
| Willoughby Sallie E | -- | -- | |
| Willoughby Sallie E | $43,000 | -- |
Source: Public Records
Mortgage History
| Date | Status | Borrower | Loan Amount |
|---|---|---|---|
| Open | Gibson Janet D | $35,968 |
Source: Public Records
Tax History
| Year | Tax Paid | Tax Assessment Tax Assessment Total Assessment is a certain percentage of the fair market value that is determined by local assessors to be the total taxable value of land and additions on the property. | Land | Improvement |
|---|---|---|---|---|
| 2025 | $1,298 | $32,400 | $10,000 | $22,400 |
| 2024 | $1,298 | $32,400 | $10,000 | $22,400 |
| 2023 | $1,298 | $32,400 | $10,000 | $22,400 |
| 2022 | $1,298 | $32,400 | $10,000 | $22,400 |
| 2021 | $153 | $32,400 | $10,000 | $22,400 |
| 2020 | $1,183 | $32,400 | $10,000 | $22,400 |
| 2019 | $1,161 | $32,400 | $10,000 | $22,400 |
| 2017 | $1,098 | $32,400 | $10,000 | $22,400 |
Source: Public Records
Map
Nearby Homes
Your Personal Tour Guide
Ask me questions while you tour the home.