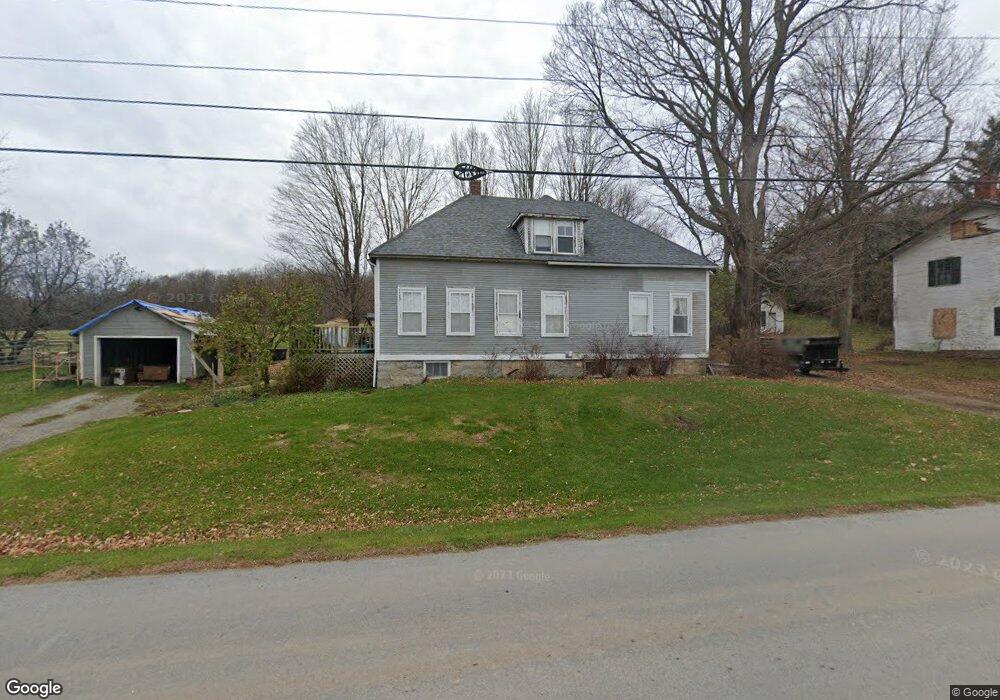
43 Tracy Rd South Hero, VT 05486
Estimated Value: $451,000 - $666,000
3
Beds
2
Baths
1,328
Sq Ft
$410/Sq Ft
Est. Value
About This Home
This home is located at 43 Tracy Rd, South Hero, VT 05486 and is currently estimated at $544,796, approximately $410 per square foot. 43 Tracy Rd is a home with nearby schools including Folsom Educational & Community Center.
Ownership History
Date
Name
Owned For
Owner Type
Purchase Details
Closed on
Jul 19, 2023
Sold by
Tracy Hobart
Bought by
King Naomi
Current Estimated Value
Purchase Details
Closed on
Jun 22, 2018
Sold by
King Naomi S and Tracy Anne H
Bought by
Lake Champlain Land Trust Inc and Vermont Housing And Conservation Board
Purchase Details
Closed on
Sep 25, 2000
Sold by
Harrison Nicholas
Bought by
Coffin Tracy Hobart and Tracy Anne Holland
Purchase Details
Closed on
Aug 13, 1998
Sold by
Harrison Marjorie T
Bought by
Harrison Nicholas A
Create a Home Valuation Report for This Property
The Home Valuation Report is an in-depth analysis detailing your home's value as well as a comparison with similar homes in the area
Home Values in the Area
Average Home Value in this Area
Purchase History
| Date | Buyer | Sale Price | Title Company |
|---|---|---|---|
| King Naomi | -- | -- | |
| King Naomi S | -- | -- | |
| King Naomi S | -- | -- | |
| King Naomi | -- | -- | |
| Lake Champlain Land Trust Inc | -- | -- | |
| Lake Champlain Land Trust Inc | -- | -- | |
| Lake Champlain Land Trust Inc | -- | -- | |
| Coffin Tracy Hobart | $155,000 | -- | |
| Harrison Nicholas A | -- | -- |
Source: Public Records
Tax History Compared to Growth
Tax History
| Year | Tax Paid | Tax Assessment Tax Assessment Total Assessment is a certain percentage of the fair market value that is determined by local assessors to be the total taxable value of land and additions on the property. | Land | Improvement |
|---|---|---|---|---|
| 2024 | $6,353 | $245,000 | $116,200 | $128,800 |
| 2023 | $4,269 | $245,000 | $116,200 | $128,800 |
| 2022 | $5,435 | $253,300 | $124,500 | $128,800 |
| 2021 | $5,243 | $253,300 | $124,500 | $128,800 |
| 2020 | $5,231 | $253,300 | $124,500 | $128,800 |
| 2019 | $5,066 | $253,300 | $124,500 | $128,800 |
| 2018 | $4,595 | $242,600 | $124,500 | $118,100 |
| 2017 | $4,488 | $242,600 | $124,500 | $118,100 |
| 2016 | $4,423 | $242,600 | $124,500 | $118,100 |
Source: Public Records
Map
Nearby Homes