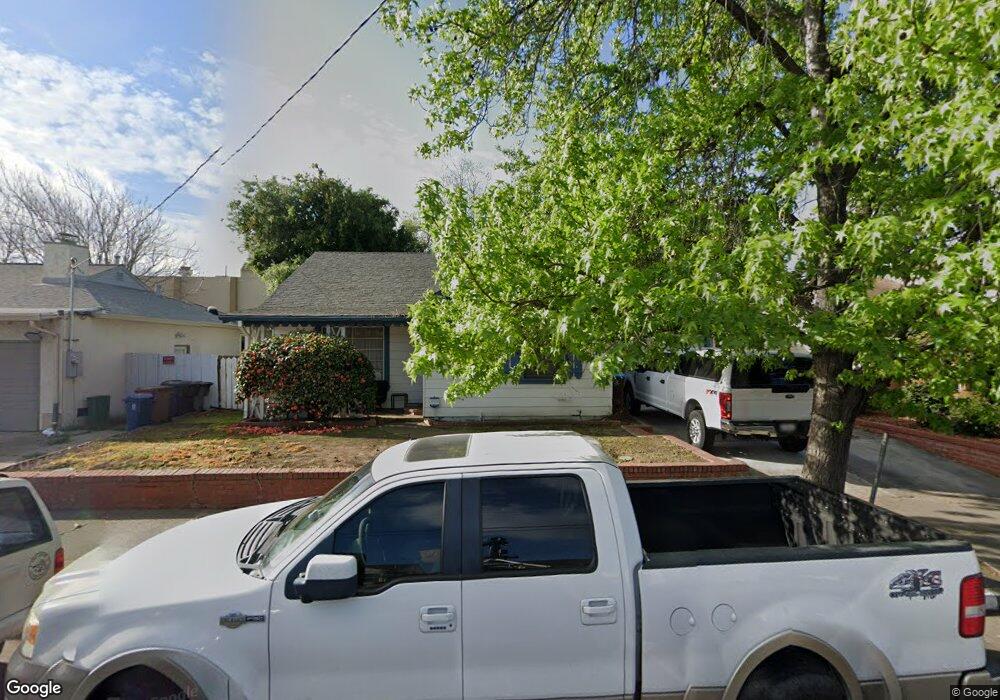
43 W 18th St Antioch, CA 94509
North Antioch NeighborhoodEstimated Value: $390,000 - $470,000
2
Beds
1
Bath
1,196
Sq Ft
$355/Sq Ft
Est. Value
About This Home
This home is located at 43 W 18th St, Antioch, CA 94509 and is currently estimated at $424,044, approximately $354 per square foot. 43 W 18th St is a home located in Contra Costa County with nearby schools including Fremont Elementary School, Antioch Middle School, and Antioch High School.
Ownership History
Date
Name
Owned For
Owner Type
Purchase Details
Closed on
May 1, 2012
Sold by
Bonner Jeanne Gilbert
Bought by
Mcburney Rachel Lynette
Current Estimated Value
Purchase Details
Closed on
Jan 21, 2003
Sold by
Heredia Mary Ellen
Bought by
Heredia Mary Ellen
Purchase Details
Closed on
Oct 8, 2001
Sold by
Geller Daniel M and Geller Mona
Bought by
Eastwood Llc
Home Financials for this Owner
Home Financials are based on the most recent Mortgage that was taken out on this home.
Original Mortgage
$2,925,000
Interest Rate
7.17%
Mortgage Type
Purchase Money Mortgage
Create a Home Valuation Report for This Property
The Home Valuation Report is an in-depth analysis detailing your home's value as well as a comparison with similar homes in the area
Home Values in the Area
Average Home Value in this Area
Purchase History
| Date | Buyer | Sale Price | Title Company |
|---|---|---|---|
| Mcburney Rachel Lynette | -- | None Available | |
| Heredia Mary Ellen | -- | -- | |
| Eastwood Llc | $3,900,000 | Old Republic Title Company |
Source: Public Records
Mortgage History
| Date | Status | Borrower | Loan Amount |
|---|---|---|---|
| Previous Owner | Eastwood Llc | $2,925,000 |
Source: Public Records
Tax History Compared to Growth
Tax History
| Year | Tax Paid | Tax Assessment Tax Assessment Total Assessment is a certain percentage of the fair market value that is determined by local assessors to be the total taxable value of land and additions on the property. | Land | Improvement |
|---|---|---|---|---|
| 2025 | $1,724 | $108,888 | $60,850 | $48,038 |
| 2024 | $1,672 | $106,754 | $59,657 | $47,097 |
| 2023 | $1,672 | $104,662 | $58,488 | $46,174 |
| 2022 | $1,651 | $102,611 | $57,342 | $45,269 |
| 2021 | $1,587 | $100,600 | $56,218 | $44,382 |
| 2019 | $1,544 | $97,617 | $54,551 | $43,066 |
| 2018 | $1,490 | $95,704 | $53,482 | $42,222 |
| 2017 | $1,445 | $93,829 | $52,434 | $41,395 |
| 2016 | $1,396 | $91,990 | $51,406 | $40,584 |
| 2015 | $1,373 | $90,609 | $50,634 | $39,975 |
| 2014 | $1,327 | $88,835 | $49,643 | $39,192 |
Source: Public Records
Map
Nearby Homes