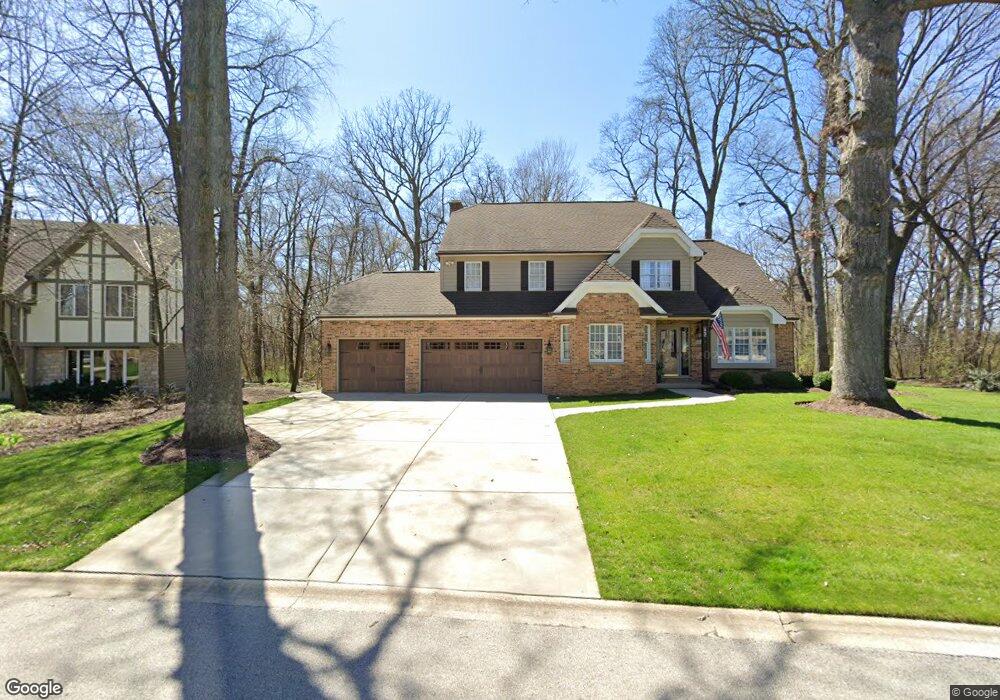
43 Walnut Cir Unit 10 Sugar Grove, IL 60554
Prestbury NeighborhoodEstimated Value: $501,122 - $612,000
--
Bed
--
Bath
2,804
Sq Ft
$201/Sq Ft
Est. Value
About This Home
This home is located at 43 Walnut Cir Unit 10, Sugar Grove, IL 60554 and is currently estimated at $563,781, approximately $201 per square foot. 43 Walnut Cir Unit 10 is a home located in Kane County with nearby schools including Fearn Elementary School, Herget Middle School, and West Aurora High School.
Ownership History
Date
Name
Owned For
Owner Type
Purchase Details
Closed on
Aug 30, 2011
Sold by
Townsend Jack C and Townsend Sarah A
Bought by
Townsend Michael S and Townsend Stephanie
Current Estimated Value
Home Financials for this Owner
Home Financials are based on the most recent Mortgage that was taken out on this home.
Original Mortgage
$240,800
Outstanding Balance
$165,997
Interest Rate
4.4%
Mortgage Type
New Conventional
Estimated Equity
$397,784
Purchase Details
Closed on
Mar 9, 1996
Sold by
Paull Catherine D and Paull Robert
Bought by
Townsend Jack C and Townsend Sarah A
Home Financials for this Owner
Home Financials are based on the most recent Mortgage that was taken out on this home.
Original Mortgage
$175,000
Interest Rate
7.36%
Create a Home Valuation Report for This Property
The Home Valuation Report is an in-depth analysis detailing your home's value as well as a comparison with similar homes in the area
Home Values in the Area
Average Home Value in this Area
Purchase History
| Date | Buyer | Sale Price | Title Company |
|---|---|---|---|
| Townsend Michael S | $301,000 | First American Title Ins Co | |
| Townsend Jack C | $247,500 | Chicago Title Insurance Co |
Source: Public Records
Mortgage History
| Date | Status | Borrower | Loan Amount |
|---|---|---|---|
| Open | Townsend Michael S | $240,800 | |
| Previous Owner | Townsend Jack C | $175,000 |
Source: Public Records
Tax History Compared to Growth
Tax History
| Year | Tax Paid | Tax Assessment Tax Assessment Total Assessment is a certain percentage of the fair market value that is determined by local assessors to be the total taxable value of land and additions on the property. | Land | Improvement |
|---|---|---|---|---|
| 2024 | $9,460 | $148,800 | $34,752 | $114,048 |
| 2023 | $9,182 | $134,199 | $31,342 | $102,857 |
| 2022 | $8,806 | $123,892 | $28,935 | $94,957 |
| 2021 | $8,569 | $117,902 | $27,536 | $90,366 |
| 2020 | $8,526 | $115,387 | $26,949 | $88,438 |
| 2019 | $8,581 | $111,615 | $26,068 | $85,547 |
| 2018 | $8,493 | $107,291 | $25,058 | $82,233 |
| 2017 | $8,304 | $102,465 | $23,931 | $78,534 |
| 2016 | $8,174 | $97,949 | $22,876 | $75,073 |
| 2015 | -- | $91,132 | $21,284 | $69,848 |
| 2014 | -- | $87,141 | $20,352 | $66,789 |
| 2013 | -- | $88,057 | $20,566 | $67,491 |
Source: Public Records
Map
Nearby Homes
- 8 Mossfield Ct
- 9 Buckingham Dr
- 778 Black Walnut Ct
- 781 Manor Hill Place
- 408 Hankes Rd
- 352 Normandie Dr
- 402 Hankes Rd
- 684 Greenfield Rd
- 1155 Mcdole Dr
- 868 Edgewood Dr
- 693 Greenfield Rd
- 933 Lakeridge Ct
- 947 Lakeridge Ct
- 706 Brighton Dr
- 954 Black Walnut Dr
- 11 Hardwick Ct
- 6 Saddlewood Ct
- 670 Sheffield Cir
- 202 Braeburn Cir Unit 1
- 7 Douglas Dr Unit 3
- 136 N Buckingham Dr
- 41 Walnut Cir
- 134 N Buckingham Dr
- 46 Walnut Cir
- 138 N Buckingham Dr
- 132 N Buckingham Dr
- 39 Walnut Cir
- 44 Walnut Cir
- 140 N Buckingham Dr Unit 10
- 137 N Buckingham Dr
- 137 N Buckingham Dr Unit 14
- 37 Walnut Cir
- 42 Walnut Cir
- 135 N Buckingham Dr
- 40 Walnut Cir
- 142 N Buckingham Dr
- 133 Walnut Cir
- 133 N Buckingham Dr
- 5 Mossfield Ct Unit 10
- 128 N Buckingham Dr