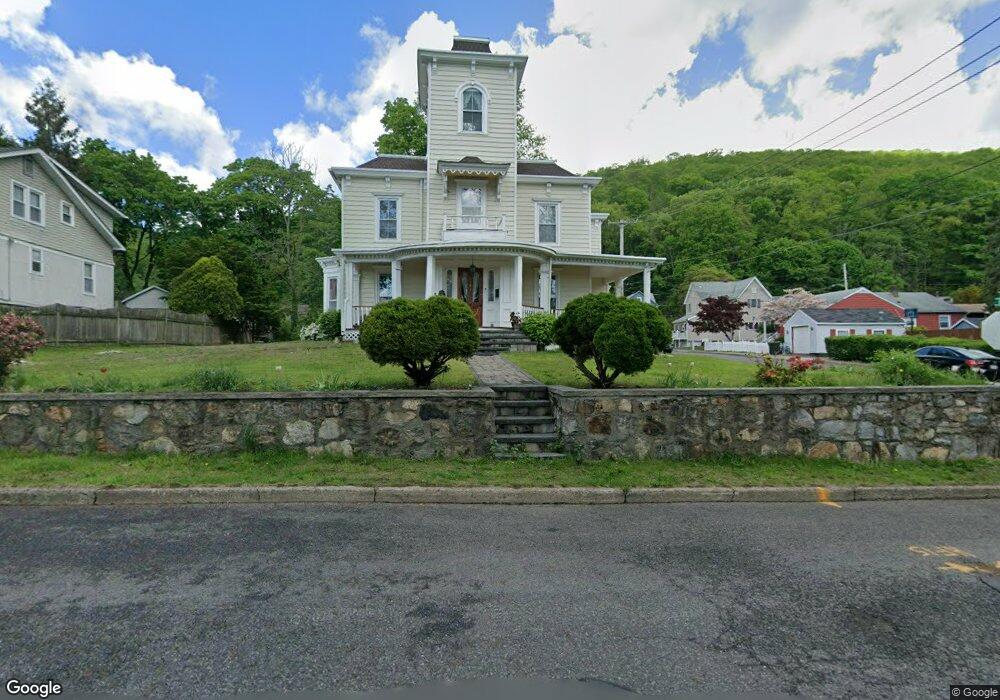
43 West St Highland Falls, NY 10928
Estimated Value: $379,000 - $457,000
4
Beds
2
Baths
2,316
Sq Ft
$188/Sq Ft
Est. Value
About This Home
This home is located at 43 West St, Highland Falls, NY 10928 and is currently estimated at $435,599, approximately $188 per square foot. 43 West St is a home located in Orange County with nearby schools including Fort Montgomery Elementary School, Highland Falls Intermediate School, and James I. O'Neill High School.
Ownership History
Date
Name
Owned For
Owner Type
Purchase Details
Closed on
Jul 25, 2025
Sold by
Villanueva Amelia
Bought by
Amelia Villanueva Lt and Villanueva
Current Estimated Value
Purchase Details
Closed on
Dec 8, 2017
Sold by
Raynor Caesar A and Villanueva Amelia
Bought by
Villanueva Amelia
Purchase Details
Closed on
May 18, 2000
Sold by
Koziak Lee Ann
Bought by
Villanueva Amelia and Raynor Caesar A
Purchase Details
Closed on
Feb 9, 1998
Sold by
Golden Raymond J and Hallenbeck Francis
Bought by
Koziak Thomas R and Koziak Lee Ann
Create a Home Valuation Report for This Property
The Home Valuation Report is an in-depth analysis detailing your home's value as well as a comparison with similar homes in the area
Home Values in the Area
Average Home Value in this Area
Purchase History
| Date | Buyer | Sale Price | Title Company |
|---|---|---|---|
| Amelia Villanueva Lt | -- | -- | |
| Villanueva Amelia | -- | -- | |
| Villanueva Amelia | -- | -- | |
| Villanueva Amelia | $99,000 | -- | |
| Villanueva Amelia | $99,000 | -- | |
| Koziak Thomas R | $40,000 | American Title Ins Co | |
| Koziak Thomas R | $40,000 | American Title Ins Co |
Source: Public Records
Tax History Compared to Growth
Tax History
| Year | Tax Paid | Tax Assessment Tax Assessment Total Assessment is a certain percentage of the fair market value that is determined by local assessors to be the total taxable value of land and additions on the property. | Land | Improvement |
|---|---|---|---|---|
| 2024 | $7,091 | $226,200 | $36,600 | $189,600 |
| 2023 | $7,091 | $226,200 | $36,600 | $189,600 |
| 2022 | $9,494 | $226,200 | $36,600 | $189,600 |
| 2021 | $7,051 | $226,200 | $36,600 | $189,600 |
| 2020 | $6,974 | $226,200 | $36,600 | $189,600 |
| 2019 | $6,751 | $226,200 | $36,600 | $189,600 |
| 2018 | $6,751 | $226,200 | $36,600 | $189,600 |
| 2017 | $6,620 | $226,200 | $36,600 | $189,600 |
| 2016 | $5,654 | $226,200 | $36,600 | $189,600 |
| 2015 | -- | $226,200 | $36,600 | $189,600 |
| 2014 | -- | $226,200 | $36,600 | $189,600 |
Source: Public Records
Map
Nearby Homes
- 28 Fort Putnam St
- 65 Church St
- 21 Cozzens Ave
- 60 Schneider Ave
- 11 Mearns Ave
- 17 Schneider Ave
- 8 McCullums Ln
- 16 Mountain Ave
- 8 Fostoria St
- 94 Mearns Ave
- 43 Villa Pkwy
- 1070 Route 9d
- 152 Old State Rd
- 24 Grassi Ln
- 7 Weyant Terrace
- 16 Fox Hollow Ln
- 1136 Route 9d
- 529 Route 9d
- 34 Hudson Ridge
- 9W FORT MONTGOMERY Route 9w