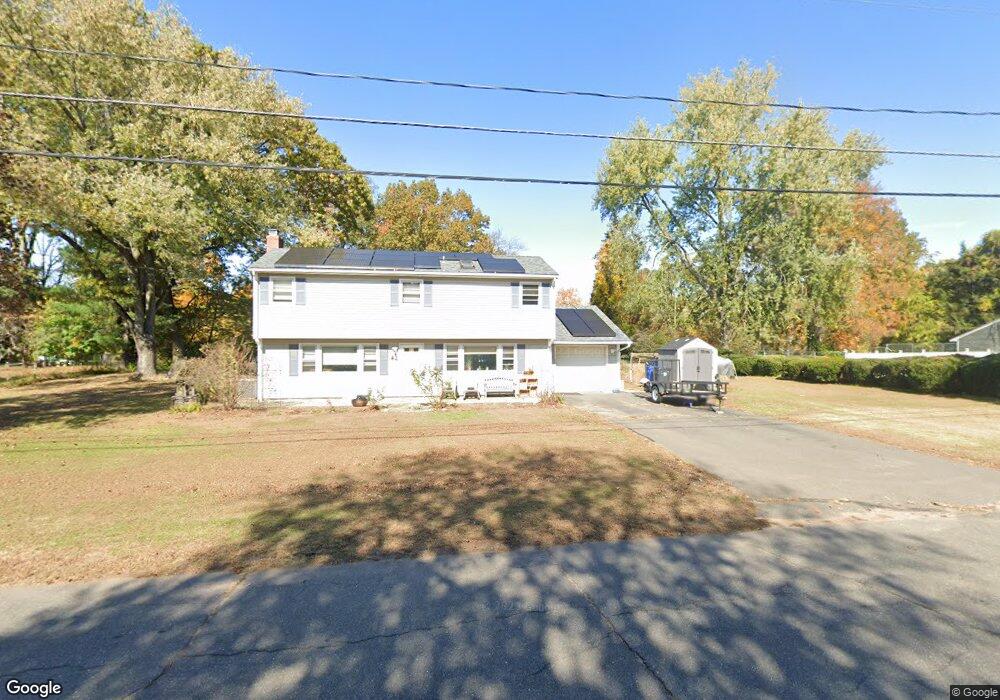
43 Winton Rd East Windsor, CT 06088
Estimated Value: $403,461 - $429,000
4
Beds
3
Baths
1,614
Sq Ft
$258/Sq Ft
Est. Value
About This Home
This home is located at 43 Winton Rd, East Windsor, CT 06088 and is currently estimated at $415,615, approximately $257 per square foot. 43 Winton Rd is a home located in Hartford County with nearby schools including Broad Brook Elementary School, East Windsor Middle School, and East Windsor High School.
Ownership History
Date
Name
Owned For
Owner Type
Purchase Details
Closed on
Apr 13, 2020
Sold by
Howell Pamela
Bought by
Howell Kimberly and Howell Christopher
Current Estimated Value
Home Financials for this Owner
Home Financials are based on the most recent Mortgage that was taken out on this home.
Original Mortgage
$226,000
Outstanding Balance
$198,947
Interest Rate
3.3%
Mortgage Type
New Conventional
Estimated Equity
$216,668
Purchase Details
Closed on
Feb 4, 2011
Sold by
Clark William D and Clark Evelyn V
Bought by
Howell Christopher J and Howell Pamela
Home Financials for this Owner
Home Financials are based on the most recent Mortgage that was taken out on this home.
Original Mortgage
$259,065
Interest Rate
4.82%
Mortgage Type
Purchase Money Mortgage
Create a Home Valuation Report for This Property
The Home Valuation Report is an in-depth analysis detailing your home's value as well as a comparison with similar homes in the area
Home Values in the Area
Average Home Value in this Area
Purchase History
| Date | Buyer | Sale Price | Title Company |
|---|---|---|---|
| Howell Kimberly | -- | None Available | |
| Howell Christopher J | $266,500 | -- |
Source: Public Records
Mortgage History
| Date | Status | Borrower | Loan Amount |
|---|---|---|---|
| Open | Howell Kimberly | $226,000 | |
| Previous Owner | Howell Christopher J | $259,065 | |
| Previous Owner | Howell Christopher J | $69,000 |
Source: Public Records
Tax History Compared to Growth
Tax History
| Year | Tax Paid | Tax Assessment Tax Assessment Total Assessment is a certain percentage of the fair market value that is determined by local assessors to be the total taxable value of land and additions on the property. | Land | Improvement |
|---|---|---|---|---|
| 2025 | $5,660 | $209,410 | $63,600 | $145,810 |
| 2024 | $5,478 | $209,410 | $63,600 | $145,810 |
| 2023 | $6,092 | $166,550 | $65,050 | $101,500 |
| 2022 | $6,137 | $166,550 | $65,050 | $101,500 |
| 2021 | $6,062 | $166,550 | $65,050 | $101,500 |
| 2020 | $6,066 | $166,550 | $65,050 | $101,500 |
| 2019 | $5,938 | $166,550 | $65,050 | $101,500 |
| 2018 | $5,879 | $166,550 | $65,050 | $101,500 |
| 2017 | $5,630 | $165,260 | $71,340 | $93,920 |
| 2016 | $5,310 | $165,260 | $71,340 | $93,920 |
| 2015 | $5,009 | $165,260 | $71,340 | $93,920 |
| 2014 | $4,921 | $165,260 | $71,340 | $93,920 |
Source: Public Records
Map
Nearby Homes
- 701 Meadowview Dr
- 20 Phelps Rd
- 100 Hayden Station Rd
- 957 Palisado Ave
- 18 Laurel Cir
- 24 MacKtown Rd
- 377 Hayden Station Rd
- 153 Scantic Rd
- 145 Scantic Rd
- 211 MacKtown Rd
- 46 Newberry Rd
- 274 Kenswick Ln Unit 274
- 1333 Palisado Ave
- 34 Stonehenge Dr
- 61 Winthrop Rd
- 136 S Center St
- 60 Tracy Cir
- 40 Alden Rd
- 625 Palisado Ave Unit 310
- 680 Kennedy Rd