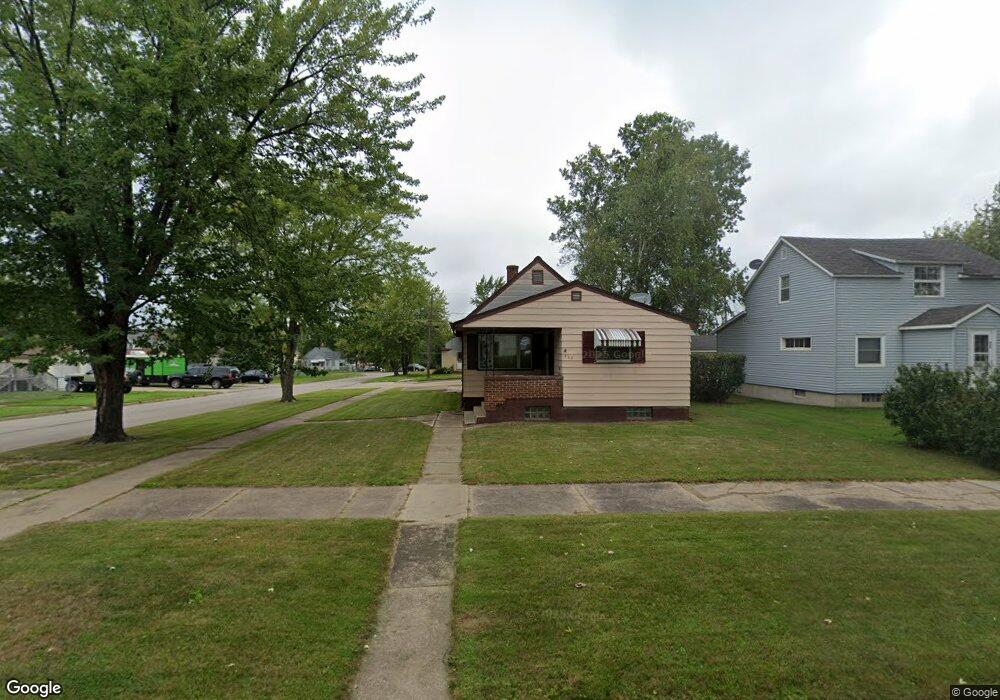
430 5th St SW Chisholm, MN 55719
Estimated Value: $82,000 - $117,000
2
Beds
2
Baths
804
Sq Ft
$128/Sq Ft
Est. Value
About This Home
This home is located at 430 5th St SW, Chisholm, MN 55719 and is currently estimated at $102,516, approximately $127 per square foot. 430 5th St SW is a home located in St. Louis County with nearby schools including Vaughan Elementary School, Chisholm Elementary School, and Chisholm Secondary School.
Ownership History
Date
Name
Owned For
Owner Type
Purchase Details
Closed on
Apr 28, 2009
Sold by
Staniger John A and Staniger Thomas E
Bought by
Heffron Patrick H
Current Estimated Value
Home Financials for this Owner
Home Financials are based on the most recent Mortgage that was taken out on this home.
Original Mortgage
$50,076
Outstanding Balance
$31,758
Interest Rate
5%
Mortgage Type
FHA
Estimated Equity
$70,758
Purchase Details
Closed on
Nov 7, 2005
Sold by
Staniger Mark E and Staniger Ann M
Bought by
Staniger John A and Staniger Thomas E
Create a Home Valuation Report for This Property
The Home Valuation Report is an in-depth analysis detailing your home's value as well as a comparison with similar homes in the area
Home Values in the Area
Average Home Value in this Area
Purchase History
| Date | Buyer | Sale Price | Title Company |
|---|---|---|---|
| Heffron Patrick H | $51,000 | None Available | |
| Staniger John A | -- | None Available |
Source: Public Records
Mortgage History
| Date | Status | Borrower | Loan Amount |
|---|---|---|---|
| Open | Heffron Patrick H | $50,076 |
Source: Public Records
Tax History Compared to Growth
Tax History
| Year | Tax Paid | Tax Assessment Tax Assessment Total Assessment is a certain percentage of the fair market value that is determined by local assessors to be the total taxable value of land and additions on the property. | Land | Improvement |
|---|---|---|---|---|
| 2024 | $550 | $88,300 | $7,200 | $81,100 |
| 2023 | $550 | $83,700 | $7,200 | $76,500 |
| 2022 | $196 | $64,700 | $5,500 | $59,200 |
| 2021 | $238 | $46,400 | $3,300 | $43,100 |
| 2020 | $208 | $46,400 | $3,300 | $43,100 |
| 2019 | $186 | $46,400 | $3,300 | $43,100 |
| 2018 | $160 | $43,500 | $3,300 | $40,200 |
| 2017 | $194 | $43,500 | $3,300 | $40,200 |
| 2016 | $216 | $47,300 | $5,000 | $42,300 |
| 2015 | $281 | $28,400 | $3,000 | $25,400 |
| 2014 | $281 | $28,300 | $3,000 | $25,300 |
Source: Public Records
Map
Nearby Homes