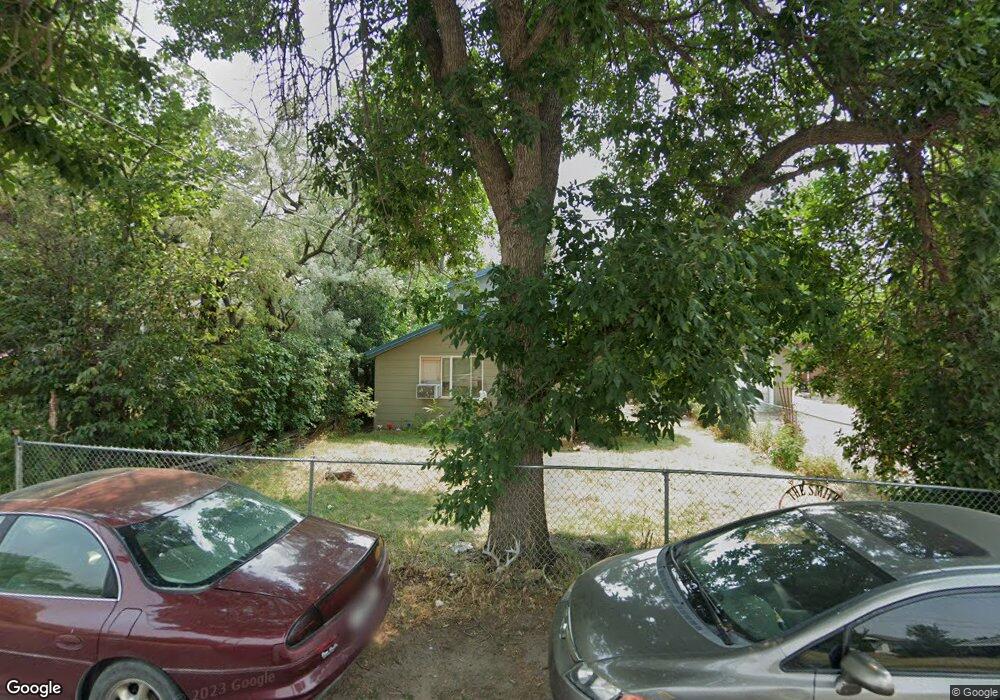
430 9th Ave SW Great Falls, MT 59404
Estimated Value: $289,000 - $379,627
5
Beds
2
Baths
1,642
Sq Ft
$198/Sq Ft
Est. Value
About This Home
This home is located at 430 9th Ave SW, Great Falls, MT 59404 and is currently estimated at $325,907, approximately $198 per square foot. 430 9th Ave SW is a home located in Cascade County with nearby schools including West Elementary School, North Middle School, and C.M. Russell High School.
Ownership History
Date
Name
Owned For
Owner Type
Purchase Details
Closed on
Jun 26, 2024
Sold by
Elston Brandon
Bought by
Mullins Rick and Mullins Victoria
Current Estimated Value
Home Financials for this Owner
Home Financials are based on the most recent Mortgage that was taken out on this home.
Original Mortgage
$294,000
Outstanding Balance
$290,509
Interest Rate
7.02%
Mortgage Type
VA
Estimated Equity
$35,398
Purchase Details
Closed on
Nov 1, 2021
Sold by
Smith Thomas and Smith Eva
Bought by
Elston Brandon
Home Financials for this Owner
Home Financials are based on the most recent Mortgage that was taken out on this home.
Original Mortgage
$238,280
Interest Rate
2.88%
Mortgage Type
VA
Purchase Details
Closed on
Apr 25, 2014
Sold by
Ferno Properties Llc
Bought by
Smith Thomas and Smith Eva
Home Financials for this Owner
Home Financials are based on the most recent Mortgage that was taken out on this home.
Original Mortgage
$132,554
Interest Rate
3.75%
Mortgage Type
FHA
Create a Home Valuation Report for This Property
The Home Valuation Report is an in-depth analysis detailing your home's value as well as a comparison with similar homes in the area
Home Values in the Area
Average Home Value in this Area
Purchase History
| Date | Buyer | Sale Price | Title Company |
|---|---|---|---|
| Mullins Rick | -- | Flying S Title | |
| Elston Brandon | -- | Chicago Title | |
| Smith Thomas | -- | Chicago Title Company |
Source: Public Records
Mortgage History
| Date | Status | Borrower | Loan Amount |
|---|---|---|---|
| Open | Mullins Rick | $294,000 | |
| Previous Owner | Elston Brandon | $238,280 | |
| Previous Owner | Smith Thomas | $132,554 |
Source: Public Records
Tax History Compared to Growth
Tax History
| Year | Tax Paid | Tax Assessment Tax Assessment Total Assessment is a certain percentage of the fair market value that is determined by local assessors to be the total taxable value of land and additions on the property. | Land | Improvement |
|---|---|---|---|---|
| 2025 | $1,374 | $260,300 | $0 | $0 |
| 2024 | $2,543 | $245,800 | $0 | $0 |
| 2023 | $2,553 | $245,800 | $0 | $0 |
| 2022 | $2,099 | $184,100 | $0 | $0 |
| 2021 | $1,914 | $181,000 | $0 | $0 |
| 2020 | $2,032 | $172,600 | $0 | $0 |
| 2019 | $1,937 | $172,600 | $0 | $0 |
| 2018 | $1,770 | $154,200 | $0 | $0 |
| 2017 | $1,675 | $154,200 | $0 | $0 |
| 2016 | $1,413 | $136,200 | $0 | $0 |
| 2015 | $1,309 | $136,200 | $0 | $0 |
| 2014 | $1,406 | $70,967 | $0 | $0 |
Source: Public Records
Map
Nearby Homes
- 1536 Meadowlark Dr Unit 9B
- 1536 Meadowlark Dr Unit 10B
- 1536 Meadowlark Dr Unit 1B
- 1540 Meadowlark Dr Unit A42
- 711 4th Ave SW
- 319 3rd Ave SW
- 726 2nd Ave SW
- 421 1st Ave SW
- 110 9th St SW
- 1927 Elm Ct
- 15 18th Ave S
- TBD U S Highway 89
- 513 4th St S
- 222 13th Ave S Unit 4
- 300 14th Ave S Unit 2
- 927 Central Ave W
- 2212 Beech Dr
- 50 Treasure State Dr
- 424 8th Ave S
- 236 17th Ave S
- 430 9th Ave SW
- 426 9th Ave SW
- 500 9th Ave SW
- 424 9th Ave SW
- 506 9th Ave SW
- 501 9th Ave SW
- 306 9th Ave SW
- 420 9th Ave SW
- 420 9th Ave SW
- 513 9th Ave SW
- 415 10th Ave SW
- 425 9th Ave SW
- 425 9th Ave SW
- 409 10th Ave SW
- 501 10th Ave SW
- 512 9th Ave SW
- 523 9th Avenue South W
- 523 9th Ave SW
- 326 9th Ave SW
- 914 4th St SW