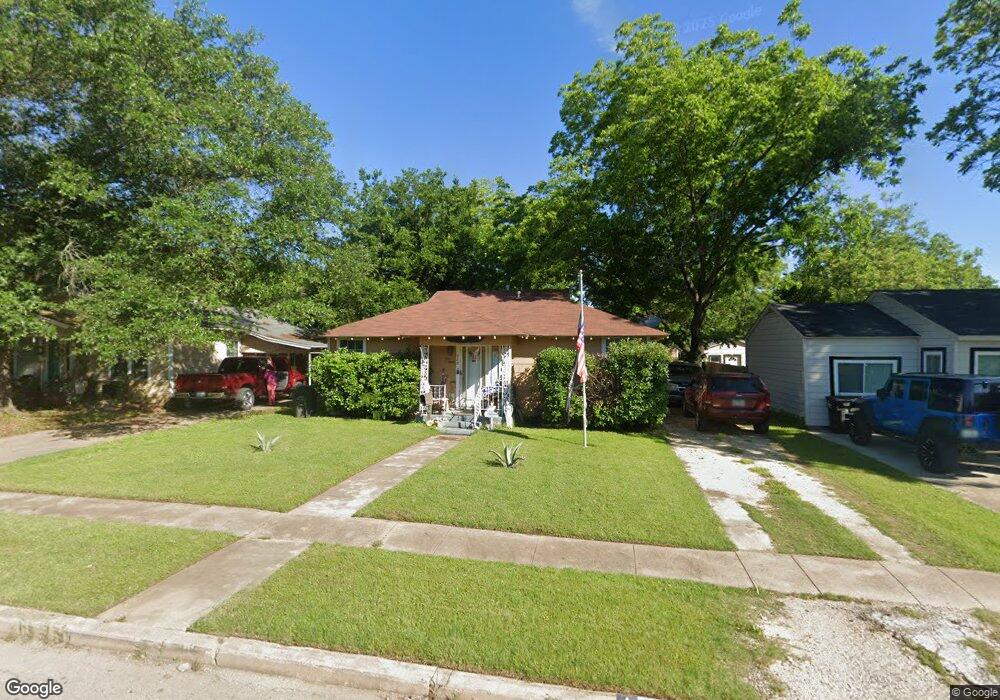
430 Bales St Cleburne, TX 76033
Estimated Value: $182,000 - $193,340
2
Beds
2
Baths
992
Sq Ft
$190/Sq Ft
Est. Value
About This Home
This home is located at 430 Bales St, Cleburne, TX 76033 and is currently estimated at $188,585, approximately $190 per square foot. 430 Bales St is a home located in Johnson County with nearby schools including Irving Elementary School, A.D. Wheat Middle School, and Cleburne High School.
Ownership History
Date
Name
Owned For
Owner Type
Purchase Details
Closed on
Nov 23, 2016
Sold by
Wells Donavan and Morales Flavia Priscila
Bought by
Rardon Kevin P and Rardon Angle B
Current Estimated Value
Home Financials for this Owner
Home Financials are based on the most recent Mortgage that was taken out on this home.
Original Mortgage
$70,140
Outstanding Balance
$56,399
Interest Rate
3.47%
Mortgage Type
VA
Estimated Equity
$132,186
Purchase Details
Closed on
Nov 27, 2013
Sold by
Parker Crouch Megan Reesing and The Estate Of Thomas Glenn Par
Bought by
Parker Davis Reeder
Purchase Details
Closed on
Jul 22, 2005
Sold by
Cavazos Willie O and Cavazos Rebecca
Bought by
Wells Donavan
Home Financials for this Owner
Home Financials are based on the most recent Mortgage that was taken out on this home.
Original Mortgage
$84,125
Interest Rate
5.95%
Mortgage Type
Adjustable Rate Mortgage/ARM
Create a Home Valuation Report for This Property
The Home Valuation Report is an in-depth analysis detailing your home's value as well as a comparison with similar homes in the area
Home Values in the Area
Average Home Value in this Area
Purchase History
| Date | Buyer | Sale Price | Title Company |
|---|---|---|---|
| Rardon Kevin P | -- | Providence Title Co | |
| Parker Davis Reeder | -- | None Available | |
| Wells Donavan | -- | Stnt |
Source: Public Records
Mortgage History
| Date | Status | Borrower | Loan Amount |
|---|---|---|---|
| Open | Rardon Kevin P | $70,140 | |
| Previous Owner | Wells Donavan | $84,125 |
Source: Public Records
Tax History Compared to Growth
Tax History
| Year | Tax Paid | Tax Assessment Tax Assessment Total Assessment is a certain percentage of the fair market value that is determined by local assessors to be the total taxable value of land and additions on the property. | Land | Improvement |
|---|---|---|---|---|
| 2025 | $696 | $207,259 | $28,000 | $179,259 |
| 2024 | $2,278 | $102,179 | $0 | $0 |
| 2023 | $696 | $207,259 | $28,000 | $179,259 |
| 2022 | $2,113 | $103,619 | $28,000 | $75,619 |
| 2021 | $2,003 | $103,619 | $28,000 | $75,619 |
| 2020 | $1,934 | $69,789 | $20,000 | $49,789 |
| 2019 | $2,062 | $69,789 | $20,000 | $49,789 |
| 2018 | $1,888 | $63,874 | $13,000 | $50,874 |
| 2017 | $1,880 | $63,874 | $13,000 | $50,874 |
| 2016 | $1,488 | $50,533 | $11,500 | $39,033 |
| 2015 | $1,347 | $50,533 | $11,500 | $39,033 |
| 2014 | $1,347 | $50,533 | $11,500 | $39,033 |
Source: Public Records
Map
Nearby Homes
- 502 Bales St
- 701 Poindexter Ave
- 308 Poindexter Ave
- 418 Marengo St
- 1103 N Walnut St
- 704 Graham St
- 1204 N Wood St
- 411 Euclid St
- 807 Poindexter Ave
- 800 Madison St
- 607 N Wood St
- 916 Poindexter Ave
- 922 N Buffalo Ave
- 107 Woodard Ave
- 603 Lilly St
- 805 Marengo St
- 5348 State Highway 171 Unit 4
- 808 Marengo St
- 902 Turner St
- 810 Euclid St