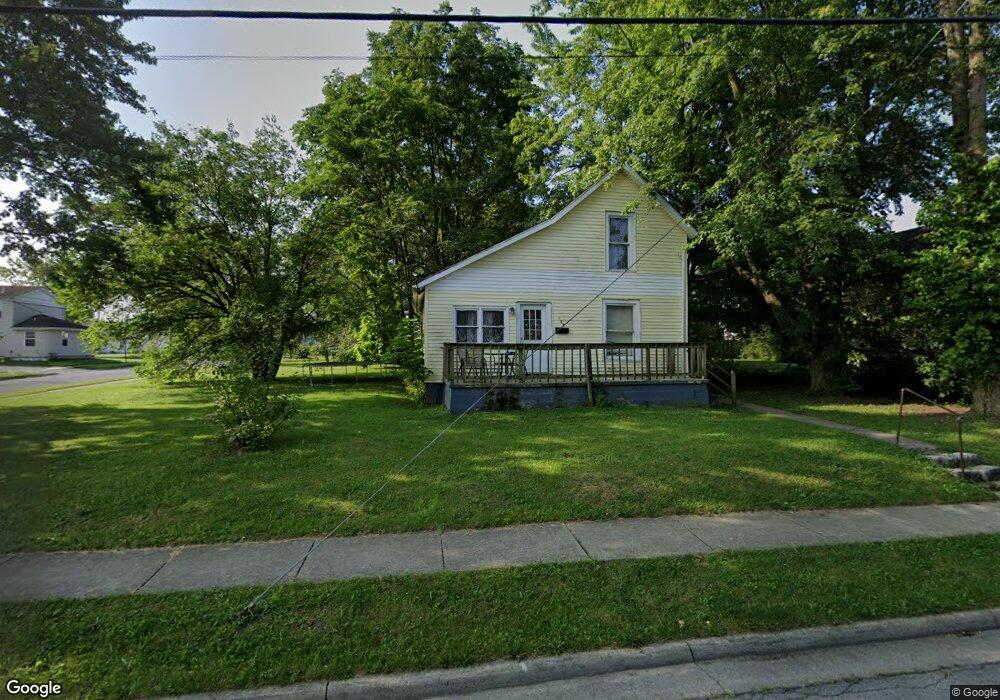
430 E 3rd St Lima, OH 45804
Southside Lima NeighborhoodEstimated Value: $51,637 - $63,000
3
Beds
1
Bath
1,121
Sq Ft
$52/Sq Ft
Est. Value
About This Home
This home is located at 430 E 3rd St, Lima, OH 45804 and is currently estimated at $58,409, approximately $52 per square foot. 430 E 3rd St is a home located in Allen County with nearby schools including Unity Elementary School, Lima North Middle School, and Lima West Middle School.
Ownership History
Date
Name
Owned For
Owner Type
Purchase Details
Closed on
Oct 16, 1996
Sold by
Clark Coleman
Bought by
Godsey Gail
Current Estimated Value
Home Financials for this Owner
Home Financials are based on the most recent Mortgage that was taken out on this home.
Original Mortgage
$35,951
Outstanding Balance
$3,404
Interest Rate
8.44%
Mortgage Type
New Conventional
Estimated Equity
$55,005
Purchase Details
Closed on
Nov 30, 1994
Sold by
Butler Lula M
Bought by
Clark Coleman
Purchase Details
Closed on
Jun 5, 1990
Bought by
Butler Lula Mae Aka
Create a Home Valuation Report for This Property
The Home Valuation Report is an in-depth analysis detailing your home's value as well as a comparison with similar homes in the area
Home Values in the Area
Average Home Value in this Area
Purchase History
| Date | Buyer | Sale Price | Title Company |
|---|---|---|---|
| Godsey Gail | $20,000 | -- | |
| Clark Coleman | $5,000 | -- | |
| Butler Lula Mae Aka | -- | -- |
Source: Public Records
Mortgage History
| Date | Status | Borrower | Loan Amount |
|---|---|---|---|
| Open | Godsey Gail | $35,951 |
Source: Public Records
Tax History
| Year | Tax Paid | Tax Assessment Tax Assessment Total Assessment is a certain percentage of the fair market value that is determined by local assessors to be the total taxable value of land and additions on the property. | Land | Improvement |
|---|---|---|---|---|
| 2024 | $440 | $10,650 | $2,630 | $8,020 |
| 2023 | $524 | $10,120 | $2,490 | $7,630 |
| 2022 | $474 | $10,120 | $2,490 | $7,630 |
| 2021 | $500 | $10,120 | $2,490 | $7,630 |
| 2020 | $536 | $9,730 | $2,450 | $7,280 |
| 2019 | $536 | $9,730 | $2,450 | $7,280 |
| 2018 | $534 | $9,730 | $2,450 | $7,280 |
| 2017 | $538 | $9,730 | $2,450 | $7,280 |
| 2016 | $1,537 | $9,730 | $2,450 | $7,280 |
| 2015 | $1,618 | $9,730 | $2,450 | $7,280 |
| 2014 | $1,618 | $10,790 | $2,560 | $8,230 |
| 2013 | $1,639 | $10,790 | $2,560 | $8,230 |
Source: Public Records
Map
Nearby Homes
Your Personal Tour Guide
Ask me questions while you tour the home.