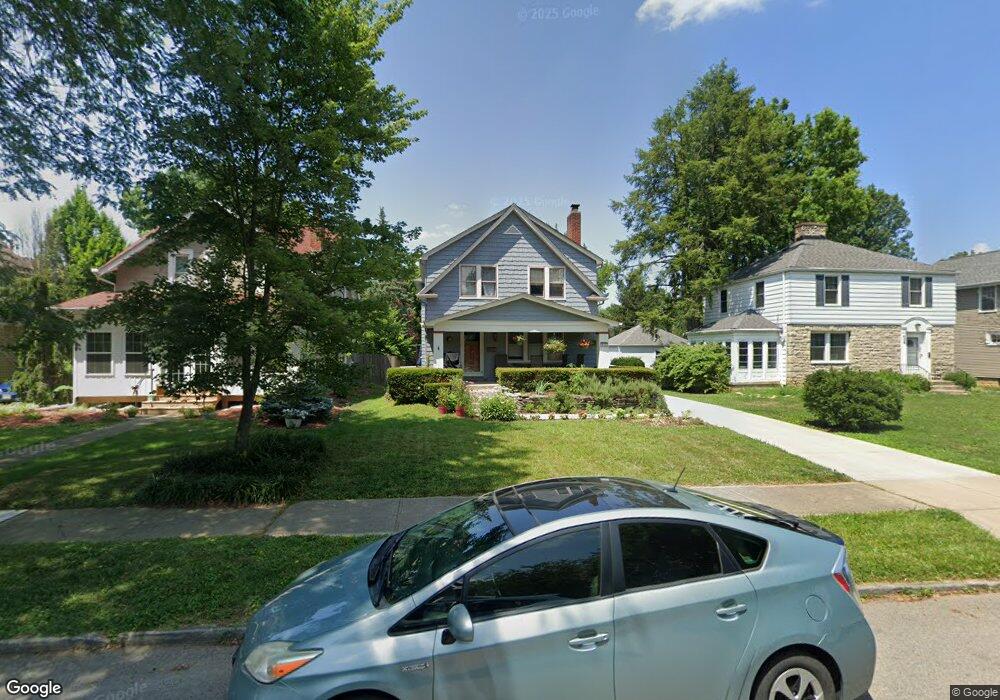
430 E Dunedin Rd Columbus, OH 43214
Clintonville NeighborhoodEstimated Value: $621,000 - $677,000
3
Beds
2
Baths
2,274
Sq Ft
$284/Sq Ft
Est. Value
About This Home
This home is located at 430 E Dunedin Rd, Columbus, OH 43214 and is currently estimated at $645,393, approximately $283 per square foot. 430 E Dunedin Rd is a home located in Franklin County with nearby schools including Clinton Elementary School, Dominion Middle School, and Whetstone High School.
Ownership History
Date
Name
Owned For
Owner Type
Purchase Details
Closed on
Jul 1, 2002
Sold by
Kronenberger Julie C
Bought by
Brinkman Marielle C
Current Estimated Value
Home Financials for this Owner
Home Financials are based on the most recent Mortgage that was taken out on this home.
Original Mortgage
$146,000
Outstanding Balance
$58,191
Interest Rate
5.87%
Estimated Equity
$587,202
Purchase Details
Closed on
Mar 18, 1999
Sold by
Vincent Renee Barrett Scott and Griffith Ma
Bought by
Brinkman Marielle C and Kronenberger Julie C
Home Financials for this Owner
Home Financials are based on the most recent Mortgage that was taken out on this home.
Original Mortgage
$148,650
Interest Rate
6.8%
Purchase Details
Closed on
Mar 14, 1995
Sold by
Leathery Donald L
Bought by
Griffith Scott V Barrett and Griffith Mara R
Home Financials for this Owner
Home Financials are based on the most recent Mortgage that was taken out on this home.
Original Mortgage
$118,300
Interest Rate
6.25%
Mortgage Type
New Conventional
Purchase Details
Closed on
Apr 29, 1991
Purchase Details
Closed on
Nov 1, 1986
Create a Home Valuation Report for This Property
The Home Valuation Report is an in-depth analysis detailing your home's value as well as a comparison with similar homes in the area
Home Values in the Area
Average Home Value in this Area
Purchase History
| Date | Buyer | Sale Price | Title Company |
|---|---|---|---|
| Brinkman Marielle C | $73,000 | Connor Title Dept | |
| Brinkman Marielle C | $174,900 | Franklin Abstract | |
| Griffith Scott V Barrett | $135,500 | -- | |
| -- | $111,000 | -- | |
| -- | $78,000 | -- |
Source: Public Records
Mortgage History
| Date | Status | Borrower | Loan Amount |
|---|---|---|---|
| Open | Brinkman Marielle C | $146,000 | |
| Previous Owner | Brinkman Marielle C | $148,650 | |
| Previous Owner | Griffith Scott V Barrett | $118,300 |
Source: Public Records
Tax History Compared to Growth
Tax History
| Year | Tax Paid | Tax Assessment Tax Assessment Total Assessment is a certain percentage of the fair market value that is determined by local assessors to be the total taxable value of land and additions on the property. | Land | Improvement |
|---|---|---|---|---|
| 2024 | $7,722 | $172,060 | $57,120 | $114,940 |
| 2023 | $7,623 | $172,060 | $57,120 | $114,940 |
| 2022 | $6,473 | $124,810 | $37,240 | $87,570 |
| 2021 | $6,485 | $124,810 | $37,240 | $87,570 |
| 2020 | $6,493 | $124,810 | $37,240 | $87,570 |
| 2019 | $5,848 | $96,400 | $28,670 | $67,730 |
| 2018 | $5,373 | $96,400 | $28,670 | $67,730 |
| 2017 | $5,844 | $96,400 | $28,670 | $67,730 |
| 2016 | $5,409 | $81,660 | $31,920 | $49,740 |
| 2015 | $4,911 | $81,660 | $31,920 | $49,740 |
| 2014 | $4,906 | $81,380 | $31,920 | $49,460 |
| 2013 | $2,355 | $77,525 | $30,415 | $47,110 |
Source: Public Records
Map
Nearby Homes
- 419 E North Broadway St
- 540 Fallis Rd
- 455 Walhalla Rd
- 217 Arden Rd
- 569 Walhalla Rd
- 374 Acton Rd
- 219 E Como Ave
- 296 Walhalla Rd
- 541 Northridge Rd
- 3386 Beulah Rd
- 612 E Como Ave
- 780 Moon Rd
- 36 Brighton Rd
- 3726 N High St
- 876 Lenore Ave
- 180 Tibet Rd
- 788 E Brighton Rd
- 886 Carolyn Ave
- 88 W Kenworth Rd
- 45 E California Ave
- 436 E Dunedin Rd
- 424 E Dunedin Rd
- 424 E Dunedin Rd Unit CLINTONVILLE
- 442 E Dunedin Rd
- 416 E Dunedin Rd
- 448 E Dunedin Rd
- 437 Piedmont Rd
- 443 Piedmont Rd
- 429 Piedmont Rd
- 449 Piedmont Rd
- 423 Piedmont Rd
- 456 E Dunedin Rd
- 427 E Dunedin Rd
- 455 Piedmont Rd
- 419 E Dunedin Rd
- 433 E Dunedin Rd
- 439 E Dunedin Rd
- 413 E Dunedin Rd
- 396 E Dunedin Rd
- 462 E Dunedin Rd