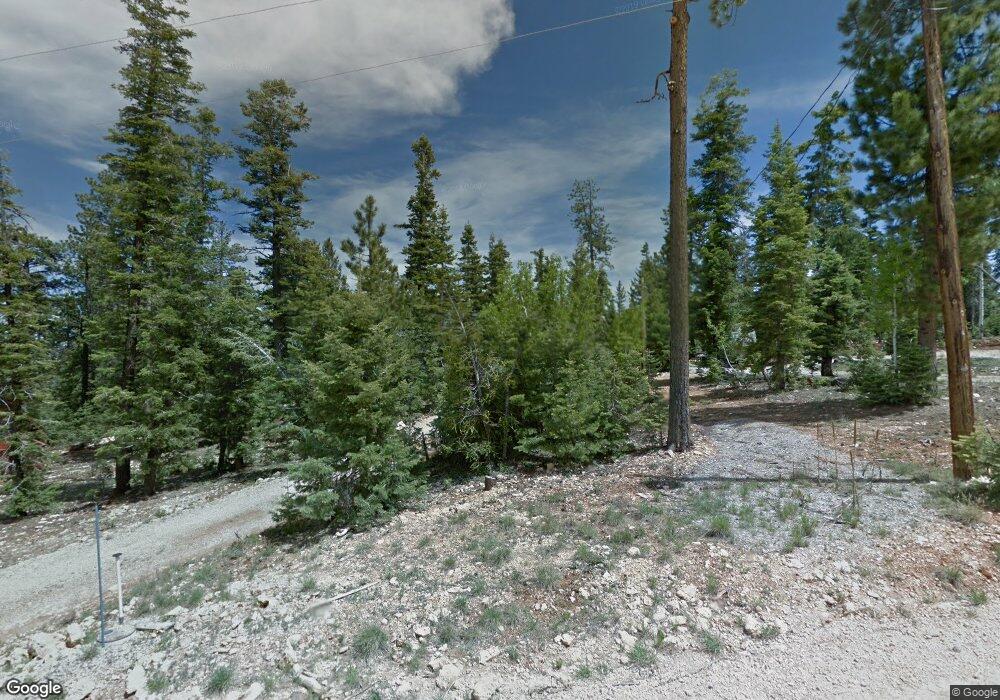
430 E Quaking Aspen Dr Kanab, UT 84741
Duck Creek Village NeighborhoodEstimated Value: $499,000 - $630,000
--
Bed
--
Bath
2,304
Sq Ft
$246/Sq Ft
Est. Value
About This Home
This home is located at 430 E Quaking Aspen Dr, Kanab, UT 84741 and is currently estimated at $565,737, approximately $245 per square foot. 430 E Quaking Aspen Dr is a home with nearby schools including Valley Elementary School and Valley High School.
Ownership History
Date
Name
Owned For
Owner Type
Purchase Details
Closed on
Oct 10, 2016
Sold by
Macdonald Joan K Trust
Bought by
Cram Curtis H and Cram Diane C
Current Estimated Value
Purchase Details
Closed on
Jul 25, 2007
Sold by
Bollinger Karen L and Bollinger Robert C
Bought by
Macdonald Joan K and Joan K Macdonald Revocable Living Trust
Create a Home Valuation Report for This Property
The Home Valuation Report is an in-depth analysis detailing your home's value as well as a comparison with similar homes in the area
Home Values in the Area
Average Home Value in this Area
Purchase History
| Date | Buyer | Sale Price | Title Company |
|---|---|---|---|
| Cram Curtis H | -- | -- | |
| Macdonald Joan K | -- | -- |
Source: Public Records
Tax History Compared to Growth
Tax History
| Year | Tax Paid | Tax Assessment Tax Assessment Total Assessment is a certain percentage of the fair market value that is determined by local assessors to be the total taxable value of land and additions on the property. | Land | Improvement |
|---|---|---|---|---|
| 2025 | $3,669 | $523,107 | $132,890 | $390,217 |
| 2024 | $3,669 | $290,785 | $67,675 | $223,110 |
| 2023 | $3,381 | $284,633 | $61,523 | $223,110 |
| 2022 | $3,362 | $250,470 | $60,260 | $190,210 |
| 2021 | $2,834 | $317,044 | $60,869 | $256,175 |
| 2020 | $2,589 | $279,525 | $55,335 | $224,190 |
| 2019 | $2,467 | $259,023 | $55,335 | $203,688 |
| 2018 | $2,281 | $237,367 | $55,335 | $182,032 |
| 2017 | $1,929 | $192,183 | $49,520 | $142,663 |
| 2016 | $1,983 | $192,183 | $49,520 | $142,663 |
| 2015 | $1,802 | $192,183 | $49,520 | $142,663 |
| 2014 | $1,802 | $174,272 | $49,520 | $124,752 |
| 2013 | -- | $157,726 | $0 | $0 |
Source: Public Records
Map
Nearby Homes
- 55 Whispering Pines Dr
- 455 Whispering Pines Dr
- 340 Porcupine Dr
- 450 Forest Dr
- 390 Quaking Aspen Dr
- 310 Quaking Aspen Dr
- 4010 Porcupine Dr
- 295 Porcupine Dr
- 350 Forest Dr
- 315 & 335 E Quaking Aspen Dr
- 136 Rim Rd
- 590 Forest Dr
- 360 Rim Rd
- 0 N Ridgeline Ct Unit 15 2808556
- 0 N Ridgeline Ct Unit 2808555
- 0 N Ridgeline Ct Unit 13 2808554
- 0 N Ridgeline Ct Unit 12 2808553
- 0 N Ridgeline Ct Unit 11 2808552
- 0 N Ridgeline Ct Unit 10 2808551
- 0 N Ridgeline Ct Unit 9 2808550
- 420 E Quaking Aspen Dr
- 440 E Quaking Aspen Dr
- 440 E Quaking Aspen Dr
- 855 W Tamarick Cir
- 0 Havasupai Dr Long Valley Estates Unit 2807567
- 0 Lot 193 Navajo Lake Estates Unit 99865
- 410 E Quaking Aspen Dr
- 450 E Quaking Aspen Dr
- 455 E Rim Rd
- 515 E Rim Rd
- 465 E Quaking Aspen Dr
- 400 E Quaking Aspen Dr
- 435 E Quaking Aspen Dr
- 460 E Quaking Aspen Dr
- 445 E Rim Rd
- 420 E Whispering Pines Dr
- 445 E Rim Rd
- 510 E Rim Rd
- 470 E Whispering Pines Dr
- 506 E Rim Rd