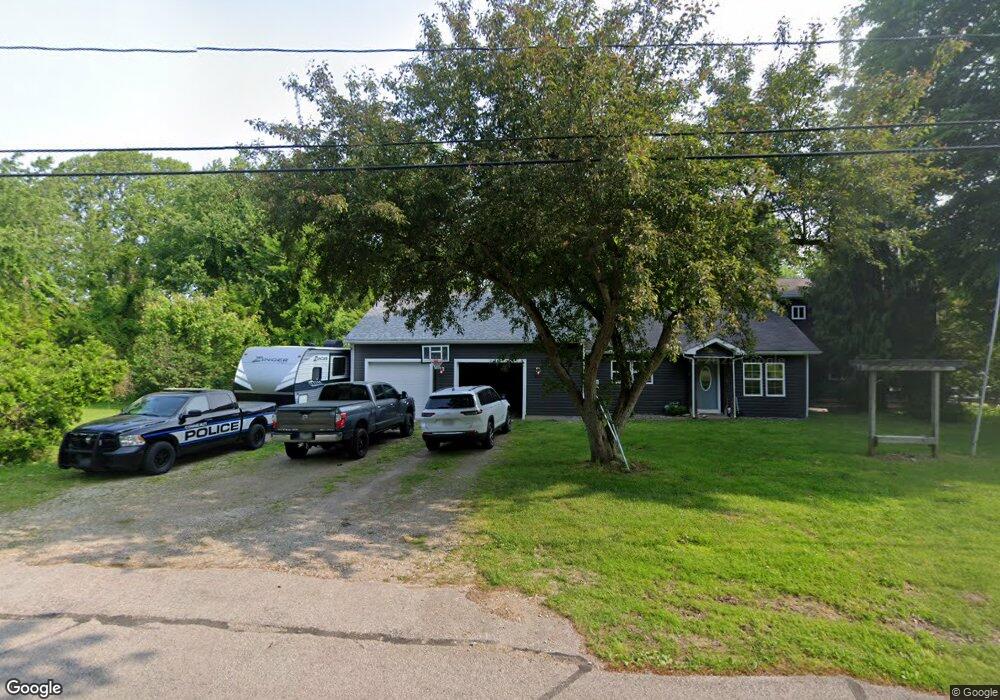
430 Gore Rd Conneaut, OH 44030
Kingsville NeighborhoodEstimated Value: $132,000 - $221,974
2
Beds
1
Bath
1,932
Sq Ft
$91/Sq Ft
Est. Value
About This Home
This home is located at 430 Gore Rd, Conneaut, OH 44030 and is currently estimated at $176,494, approximately $91 per square foot. 430 Gore Rd is a home located in Ashtabula County with nearby schools including Lakeshore Primary Elementary School, Gateway Elementary School, and Conneaut Middle School.
Ownership History
Date
Name
Owned For
Owner Type
Purchase Details
Closed on
Aug 6, 2021
Sold by
Estate Of Suzanne L Fralic
Bought by
Burton Nancy and Fralic Paul
Current Estimated Value
Purchase Details
Closed on
Apr 3, 2007
Sold by
Ezzone Thomas M and Ezzone Holly S
Bought by
Ezzone Thomas M and Ezzone Holly S
Create a Home Valuation Report for This Property
The Home Valuation Report is an in-depth analysis detailing your home's value as well as a comparison with similar homes in the area
Home Values in the Area
Average Home Value in this Area
Purchase History
| Date | Buyer | Sale Price | Title Company |
|---|---|---|---|
| Burton Nancy | -- | None Available | |
| Ezzone Thomas M | -- | Accommodation |
Source: Public Records
Tax History Compared to Growth
Tax History
| Year | Tax Paid | Tax Assessment Tax Assessment Total Assessment is a certain percentage of the fair market value that is determined by local assessors to be the total taxable value of land and additions on the property. | Land | Improvement |
|---|---|---|---|---|
| 2024 | $4,161 | $56,880 | $18,730 | $38,150 |
| 2023 | $2,686 | $56,880 | $18,730 | $38,150 |
| 2022 | $2,288 | $42,670 | $14,390 | $28,280 |
| 2021 | $2,327 | $42,670 | $14,390 | $28,280 |
| 2020 | $1,975 | $36,200 | $14,390 | $21,810 |
| 2019 | $1,929 | $34,730 | $13,130 | $21,600 |
| 2018 | $1,841 | $34,730 | $13,130 | $21,600 |
| 2017 | $1,838 | $34,730 | $13,130 | $21,600 |
| 2016 | $1,513 | $31,050 | $11,730 | $19,320 |
| 2015 | $1,529 | $31,050 | $11,730 | $19,320 |
| 2014 | $953 | $31,050 | $11,730 | $19,320 |
| 2013 | $1,160 | $36,650 | $9,450 | $27,200 |
Source: Public Records
Map
Nearby Homes
- 40 Oakland Blvd
- 106 Margor Dr
- 531 W Main Rd
- 1300 Lake Rd
- 202 W Main Rd Unit 49
- 202 W Main Rd Unit Lot 150
- 202 W Main Rd Unit 33
- 202 W Main Rd Unit 16
- 4377 E Center St
- 210 W Main Rd
- 220 Daniels Ave
- 57 Eaton Dr
- 0 Creek Rd Unit 5146859
- 4017 Lake Rd Unit 17
- 2663 Lake Rd
- 3988 Lake Rd
- 7842 Cleveland Dr
- 1150 Lake Rd
- 1145 Lake Rd
- 855 Spring St Unit S9