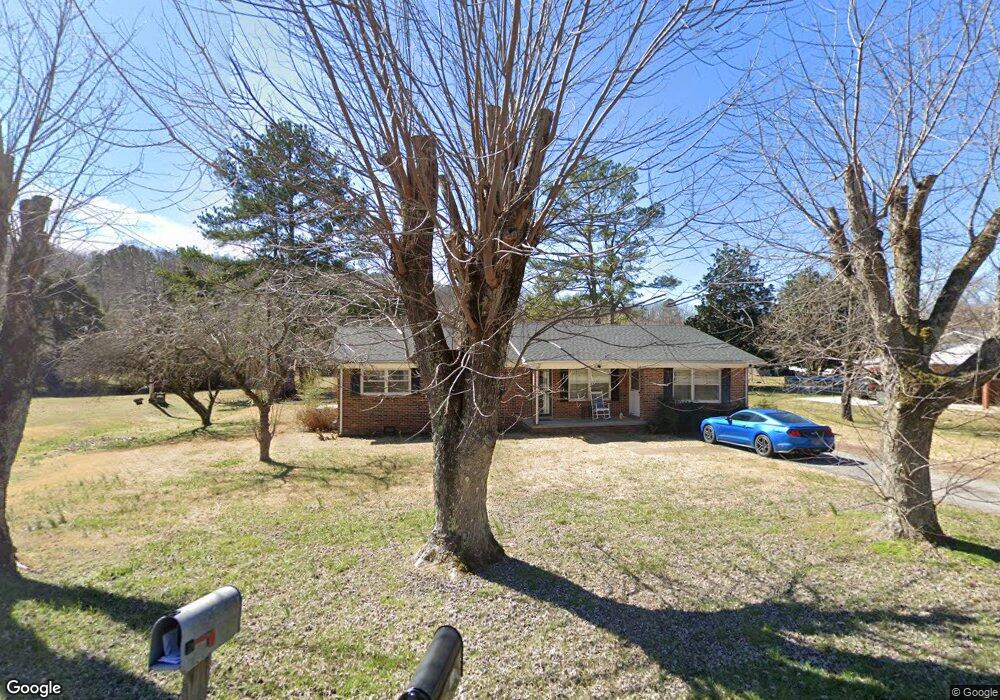
430 Hurricane Meadows Dr Waynesboro, TN 38485
Estimated Value: $184,000 - $189,335
3
Beds
1
Bath
1,699
Sq Ft
$110/Sq Ft
Est. Value
About This Home
This home is located at 430 Hurricane Meadows Dr, Waynesboro, TN 38485 and is currently estimated at $187,584, approximately $110 per square foot. 430 Hurricane Meadows Dr is a home located in Wayne County with nearby schools including Wayne Academy.
Ownership History
Date
Name
Owned For
Owner Type
Purchase Details
Closed on
Jul 13, 2023
Sold by
Scoggin John Denton-Jubal and Scoggin Callie
Bought by
Rainwater Brent K
Current Estimated Value
Home Financials for this Owner
Home Financials are based on the most recent Mortgage that was taken out on this home.
Original Mortgage
$176,739
Outstanding Balance
$172,523
Interest Rate
6.79%
Mortgage Type
FHA
Estimated Equity
$15,061
Purchase Details
Closed on
Jul 19, 2022
Sold by
Sheila Harris
Bought by
Scoggin John Denton-Jubal and Scoggin Callie
Home Financials for this Owner
Home Financials are based on the most recent Mortgage that was taken out on this home.
Original Mortgage
$138,400
Interest Rate
5.23%
Mortgage Type
New Conventional
Purchase Details
Closed on
Feb 2, 2012
Sold by
Garner Bonnie Lois
Bought by
Harris Sheila
Purchase Details
Closed on
Apr 27, 1973
Bought by
Garner Curtis
Create a Home Valuation Report for This Property
The Home Valuation Report is an in-depth analysis detailing your home's value as well as a comparison with similar homes in the area
Home Values in the Area
Average Home Value in this Area
Purchase History
| Date | Buyer | Sale Price | Title Company |
|---|---|---|---|
| Rainwater Brent K | $180,000 | None Listed On Document | |
| Rainwater Brent K | $180,000 | None Listed On Document | |
| Scoggin John Denton-Jubal | -- | None Listed On Document | |
| Harris Sheila | -- | -- | |
| Garner Curtis | -- | -- |
Source: Public Records
Mortgage History
| Date | Status | Borrower | Loan Amount |
|---|---|---|---|
| Open | Rainwater Brent K | $176,739 | |
| Closed | Rainwater Brent K | $176,739 | |
| Previous Owner | Scoggin John Denton-Jubal | $138,400 |
Source: Public Records
Tax History Compared to Growth
Tax History
| Year | Tax Paid | Tax Assessment Tax Assessment Total Assessment is a certain percentage of the fair market value that is determined by local assessors to be the total taxable value of land and additions on the property. | Land | Improvement |
|---|---|---|---|---|
| 2024 | $591 | $27,250 | $1,875 | $25,375 |
| 2023 | $833 | $26,775 | $1,875 | $24,900 |
| 2022 | $833 | $26,775 | $1,875 | $24,900 |
| 2021 | $661 | $26,775 | $1,875 | $24,900 |
| 2020 | $661 | $17,650 | $1,375 | $16,275 |
| 2019 | $511 | $17,650 | $1,375 | $16,275 |
| 2018 | $661 | $17,650 | $1,375 | $16,275 |
| 2017 | $661 | $17,650 | $1,375 | $16,275 |
| 2016 | $617 | $17,650 | $1,375 | $16,275 |
| 2014 | $661 | $18,790 | $0 | $0 |
Source: Public Records
Map
Nearby Homes
- 418 Moore St
- 123 Brewer Dr
- 131 Susan Ln
- 117 Belew Cir
- 117 N High St
- 0 Waynesboro Hwy Unit RTC2991221
- 0 Waynesboro Hwy Unit RTC2806893
- 202 Morris St
- 107 W Songer St
- 110 Turman St
- 308 S High St
- 214 Mcwilliams St
- 310 W Hill St
- 120 Wallace Dr
- 1027 Highway 99
- 617 Walnut St
- 656 Waynesboro Hwy
- 408 Poplar St
- 421 Highway 64 W
- 446 Kilburn Hollow Rd
- 428 Hurricane Meadows Dr
- 432 Hurricane Meadows Dr
- 429 Hurricane Meadows Dr
- 426 Hurricane Meadows Dr
- 502 Hurricane Meadows Dr
- 425 Hurricane Meadows Dr
- 424 Hurricane Meadows Dr
- 505 Hurricane Hill Dr
- 420 Hurricane Meadows Dr
- 419 Hurricane Meadows Dr
- 507 Hurricane Meadows Dr
- 417 Hurricane Meadows Dr
- ) U S Highway 64
- 513 Hurricane Hill Dr
- 512 Hurricane Hill Dr
- 412 Hurricane Meadows Dr
- 514 Hurricane Hill Dr
- 305 Folger St
- 515 Hurricane Hill Dr
- 409 Hurricane Meadows Dr