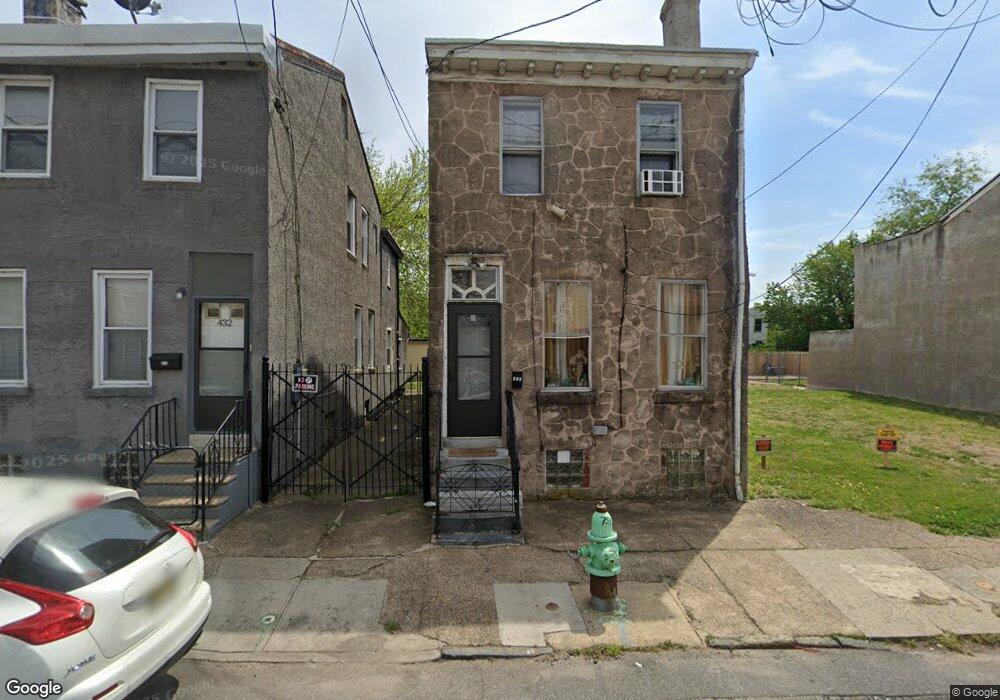
430 Line St Camden, NJ 08103
Lanning Square NeighborhoodEstimated Value: $122,000 - $190,000
--
Bed
--
Bath
1,936
Sq Ft
$75/Sq Ft
Est. Value
About This Home
This home is located at 430 Line St, Camden, NJ 08103 and is currently estimated at $144,944, approximately $74 per square foot. 430 Line St is a home located in Camden County with nearby schools including Camden High School, Hope Community Charter School, and Leap Academy University Charter School.
Ownership History
Date
Name
Owned For
Owner Type
Purchase Details
Closed on
Oct 19, 2016
Sold by
Gregga Raquel
Bought by
Atro Uriel Angel Perez M
Current Estimated Value
Home Financials for this Owner
Home Financials are based on the most recent Mortgage that was taken out on this home.
Original Mortgage
$39,176
Outstanding Balance
$31,809
Interest Rate
3.87%
Mortgage Type
FHA
Estimated Equity
$113,135
Purchase Details
Closed on
Oct 3, 1997
Sold by
Concepcion Saro Juan
Bought by
Marquez Rosa R
Create a Home Valuation Report for This Property
The Home Valuation Report is an in-depth analysis detailing your home's value as well as a comparison with similar homes in the area
Home Values in the Area
Average Home Value in this Area
Purchase History
| Date | Buyer | Sale Price | Title Company |
|---|---|---|---|
| Atro Uriel Angel Perez M | $39,900 | Brennan Title Abstract | |
| Marquez Rosa R | $25,000 | -- |
Source: Public Records
Mortgage History
| Date | Status | Borrower | Loan Amount |
|---|---|---|---|
| Open | Atro Uriel Angel Perez M | $39,176 |
Source: Public Records
Tax History Compared to Growth
Tax History
| Year | Tax Paid | Tax Assessment Tax Assessment Total Assessment is a certain percentage of the fair market value that is determined by local assessors to be the total taxable value of land and additions on the property. | Land | Improvement |
|---|---|---|---|---|
| 2025 | $1,399 | $39,500 | $7,000 | $32,500 |
| 2024 | $1,353 | $39,500 | $7,000 | $32,500 |
| 2023 | $1,353 | $39,500 | $7,000 | $32,500 |
| 2022 | $1,328 | $39,500 | $7,000 | $32,500 |
| 2021 | $703 | $17,200 | $0 | $0 |
| 2020 | $547 | $17,200 | $0 | $0 |
| 2019 | $524 | $39,500 | $7,000 | $32,500 |
| 2018 | $521 | $39,500 | $7,000 | $32,500 |
| 2017 | $508 | $39,500 | $7,000 | $32,500 |
| 2016 | $492 | $17,200 | $7,000 | $10,200 |
| 2015 | $474 | $17,200 | $7,000 | $10,200 |
| 2014 | $462 | $17,200 | $7,000 | $10,200 |
Source: Public Records
Map
Nearby Homes