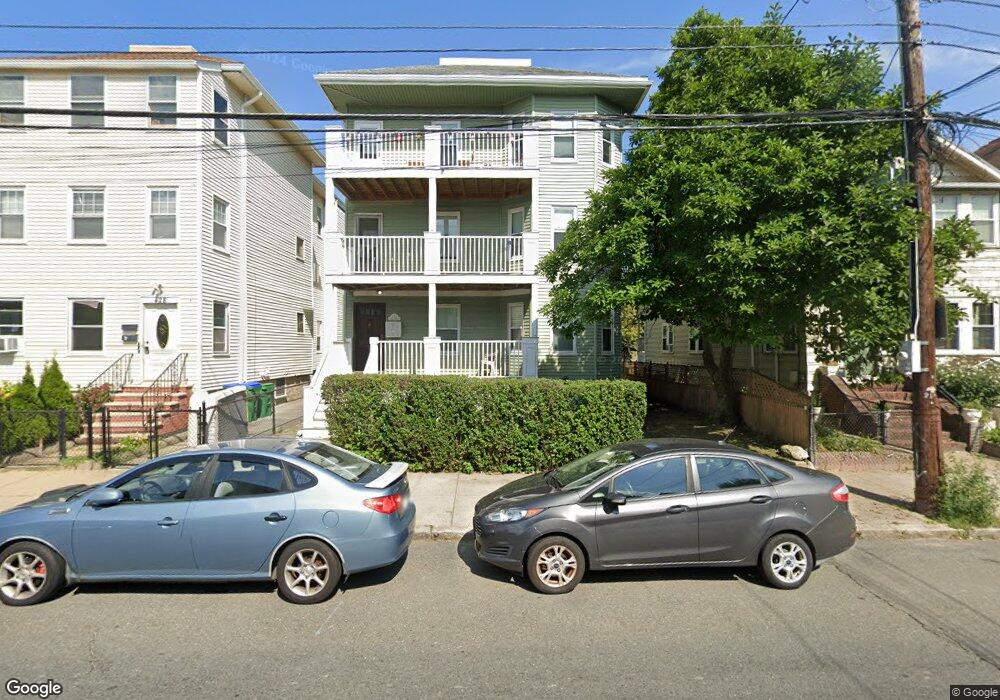
430 Main St Medford, MA 02155
South Medford NeighborhoodEstimated Value: $1,037,720 - $1,299,000
6
Beds
3
Baths
3,528
Sq Ft
$331/Sq Ft
Est. Value
About This Home
This home is located at 430 Main St, Medford, MA 02155 and is currently estimated at $1,166,680, approximately $330 per square foot. 430 Main St is a home located in Middlesex County with nearby schools including Medford High School and St. Clement Elementary School.
Ownership History
Date
Name
Owned For
Owner Type
Purchase Details
Closed on
Oct 31, 2014
Sold by
Hankinson Scott W
Bought by
Mclaughlin Kevin
Current Estimated Value
Home Financials for this Owner
Home Financials are based on the most recent Mortgage that was taken out on this home.
Original Mortgage
$367,500
Outstanding Balance
$121,606
Interest Rate
4.21%
Mortgage Type
New Conventional
Estimated Equity
$1,045,074
Purchase Details
Closed on
Jun 27, 1996
Sold by
Mitchell N Bezreh T
Bought by
Hankinson Scott W
Home Financials for this Owner
Home Financials are based on the most recent Mortgage that was taken out on this home.
Original Mortgage
$171,000
Interest Rate
8.05%
Mortgage Type
Purchase Money Mortgage
Create a Home Valuation Report for This Property
The Home Valuation Report is an in-depth analysis detailing your home's value as well as a comparison with similar homes in the area
Home Values in the Area
Average Home Value in this Area
Purchase History
| Date | Buyer | Sale Price | Title Company |
|---|---|---|---|
| Mclaughlin Kevin | $525,000 | -- | |
| Hankinson Scott W | $180,000 | -- |
Source: Public Records
Mortgage History
| Date | Status | Borrower | Loan Amount |
|---|---|---|---|
| Open | Mclaughlin Kevin | $367,500 | |
| Previous Owner | Hankinson Scott W | $171,000 |
Source: Public Records
Tax History Compared to Growth
Tax History
| Year | Tax Paid | Tax Assessment Tax Assessment Total Assessment is a certain percentage of the fair market value that is determined by local assessors to be the total taxable value of land and additions on the property. | Land | Improvement |
|---|---|---|---|---|
| 2025 | $9,635 | $1,094,900 | $322,900 | $772,000 |
| 2024 | $8,854 | $1,039,200 | $307,600 | $731,600 |
| 2023 | $8,728 | $1,009,000 | $287,500 | $721,500 |
| 2022 | $8,855 | $982,800 | $261,300 | $721,500 |
| 2021 | $8,632 | $917,300 | $248,900 | $668,400 |
| 2020 | $8,258 | $899,600 | $248,900 | $650,700 |
| 2019 | $8,127 | $846,600 | $226,200 | $620,400 |
| 2018 | $7,942 | $775,600 | $205,700 | $569,900 |
| 2017 | $7,354 | $696,400 | $192,200 | $504,200 |
| 2016 | $5,702 | $509,600 | $174,800 | $334,800 |
| 2015 | $5,458 | $466,500 | $166,400 | $300,100 |
Source: Public Records
Map
Nearby Homes
- 11 Bonner Ave Unit 2
- 39 Bonner Ave Unit 39
- 501 Main St
- 159 Harvard St Unit 1R
- 595 Broadway Unit 302
- 595 Broadway Unit 101
- 595 Broadway Unit 202
- 561 Broadway Unit C1
- 57 Edward St
- 552 Main St
- 12 Wellesley St
- 15 Colby St
- 9 Trout Ave
- 9 Trout Ave Unit 2
- 34 Fiske Ave Unit C
- 34 Fiske Ave Unit B
- 34 Fiske Ave Unit A
- 3 Vinal St
- 474 Broadway Unit 26
- 26 Warner St
- 430 Main St Unit 3
- 428 Main St
- 428 Main St Unit 1
- 428 Main St Unit 3
- 428 Main St
- 428 Main St Unit 2
- 432 Main St
- 436 Main St
- 9 Mayberry Ave
- 9 Mayberry Ave Unit 1
- 8 Willard Ave
- 8 Willard Ave Unit 2
- 8 Willard Ave Unit 3
- 8 Willard Ave Unit 1
- 422 Main St
- 11 Mayberry Ave
- 427 Main St
- 427 Main St Unit 2
- 427 Main St Unit 1
- 12 Willard Ave