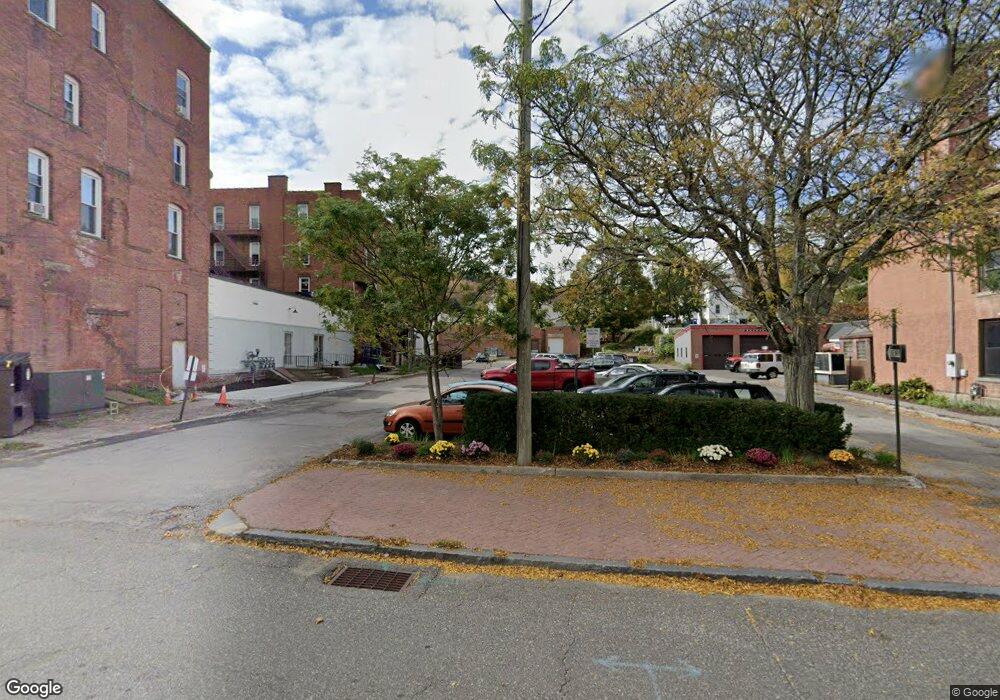
430 Main St Winsted, CT 06098
Estimated Value: $350,217
Studio
--
Bath
9,508
Sq Ft
$37/Sq Ft
Est. Value
About This Home
This home is located at 430 Main St, Winsted, CT 06098 and is currently estimated at $350,217, approximately $36 per square foot. 430 Main St is a home located in Litchfield County with nearby schools including Pearson School, Explorations Charter School, and St Anthony School.
Ownership History
Date
Name
Owned For
Owner Type
Purchase Details
Closed on
Aug 3, 2023
Sold by
Wendy & Mike Winsted Llc
Bought by
Noujaim 430 Main Llc
Current Estimated Value
Home Financials for this Owner
Home Financials are based on the most recent Mortgage that was taken out on this home.
Original Mortgage
$240,000
Outstanding Balance
$233,168
Interest Rate
6.67%
Mortgage Type
Purchase Money Mortgage
Estimated Equity
$117,049
Purchase Details
Closed on
Jun 12, 2020
Sold by
Chung General Contractors
Bought by
Wendy & Mike Winsted Llc
Purchase Details
Closed on
Jan 17, 2017
Sold by
434 Main Street Llc
Bought by
Chung General Contract
Home Financials for this Owner
Home Financials are based on the most recent Mortgage that was taken out on this home.
Original Mortgage
$185,600
Interest Rate
4.08%
Mortgage Type
Commercial
Purchase Details
Closed on
Mar 29, 2012
Sold by
Oneil Michael O and Oneil Charlene B
Bought by
434 Main Street Llc
Purchase Details
Closed on
Aug 1, 1979
Bought by
434 Main Llc
Create a Home Valuation Report for This Property
The Home Valuation Report is an in-depth analysis detailing your home's value as well as a comparison with similar homes in the area
Home Values in the Area
Average Home Value in this Area
Purchase History
| Date | Buyer | Sale Price | Title Company |
|---|---|---|---|
| Noujaim 430 Main Llc | $300,000 | None Available | |
| Noujaim 430 Main Llc | $300,000 | None Available | |
| Wendy & Mike Winsted Llc | $232,000 | None Available | |
| Wendy & Mike Winsted Llc | $232,000 | None Available | |
| Chung General Contract | $232,000 | -- | |
| Chung General Contract | $232,000 | -- | |
| 434 Main Street Llc | -- | -- | |
| 434 Main Street Llc | -- | -- | |
| 434 Main Street Llc | -- | -- | |
| 434 Main Llc | -- | -- |
Source: Public Records
Mortgage History
| Date | Status | Borrower | Loan Amount |
|---|---|---|---|
| Open | Noujaim 430 Main Llc | $240,000 | |
| Closed | Noujaim 430 Main Llc | $240,000 | |
| Previous Owner | Chung General Contract | $185,600 |
Source: Public Records
Tax History
| Year | Tax Paid | Tax Assessment Tax Assessment Total Assessment is a certain percentage of the fair market value that is determined by local assessors to be the total taxable value of land and additions on the property. | Land | Improvement |
|---|---|---|---|---|
| 2025 | $6,699 | $229,670 | $38,080 | $191,590 |
| 2024 | $6,256 | $229,670 | $38,080 | $191,590 |
| 2023 | $6,061 | $229,670 | $38,080 | $191,590 |
| 2022 | $5,212 | $155,400 | $34,020 | $121,380 |
| 2021 | $5,212 | $155,400 | $34,020 | $121,380 |
| 2020 | $5,212 | $155,400 | $34,020 | $121,380 |
| 2019 | $5,212 | $155,400 | $34,020 | $121,380 |
| 2018 | $5,212 | $155,400 | $34,020 | $121,380 |
| 2017 | $5,954 | $177,520 | $48,580 | $128,940 |
| 2016 | $5,954 | $177,520 | $48,580 | $128,940 |
| 2015 | $5,805 | $177,520 | $48,580 | $128,940 |
| 2014 | $5,665 | $177,520 | $48,580 | $128,940 |
Source: Public Records
Map
Nearby Homes
Your Personal Tour Guide
Ask me questions while you tour the home.